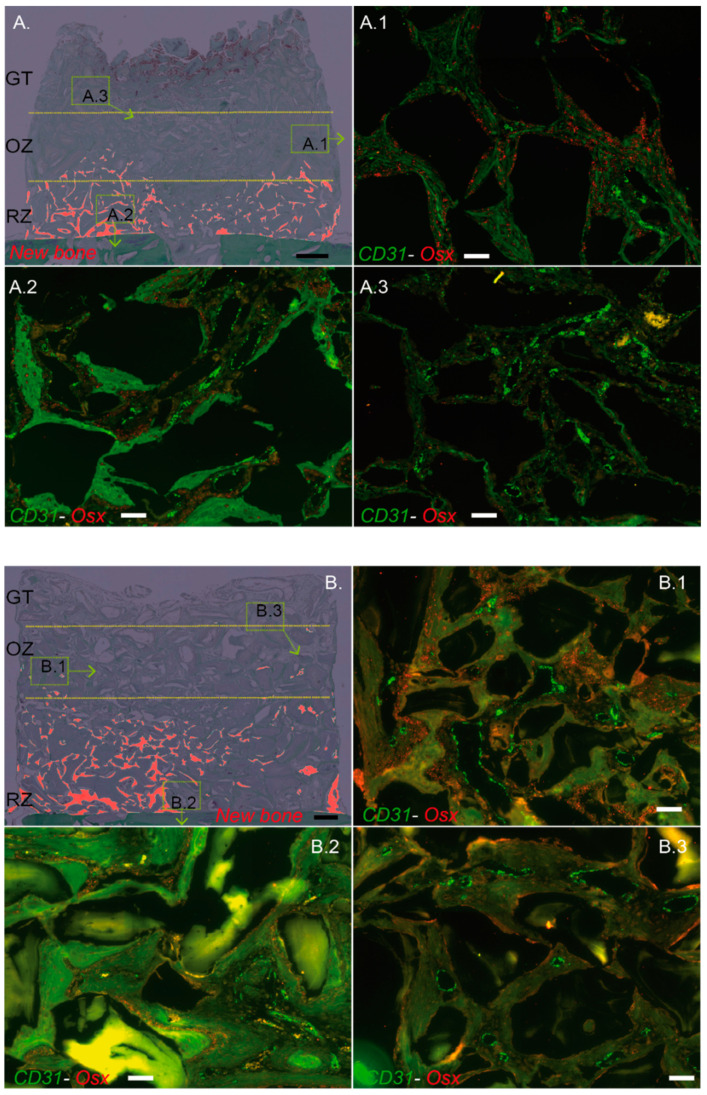
Figure 3.
Description of the dynamic and controlled model of osteogenesis. Cylinder contents pictures from Figure 2A,B were digitally processed to highlight the new bone in red ((A), 2 weeks; (B), 4 weeks). RZ, OZ and GT are delimited by yellow dotted lines. A representative zone from OZ (A.1,B.1), RZ (A.2,B.2), and GT (A.3,B.3) was magnified and analyzed by RNA hybridization for CD31 (green dots) and Osterix (OSX, red dots). Note that each zone was highly vascularized either at 2 or 4 weeks, as assessed by the green dots tagging specifically CD31 mRNA (A.1–3,B.1–3). Osteogenic precursors in which OSX is highly expressed (red dots, OSX mRNA) were mostly observed in the osteogenic zone at 2 (A.1) and 4 weeks (B.1). OSX precursors were also present in the remodeling zone but at a lower rate when compared to OZ, either at 2 or 4 weeks (A.2,B.2), respectively, whereas they were very sparsely observed within the GT (A.3,B.3). Black bars: 500 µm, White bars: 100 µm.

