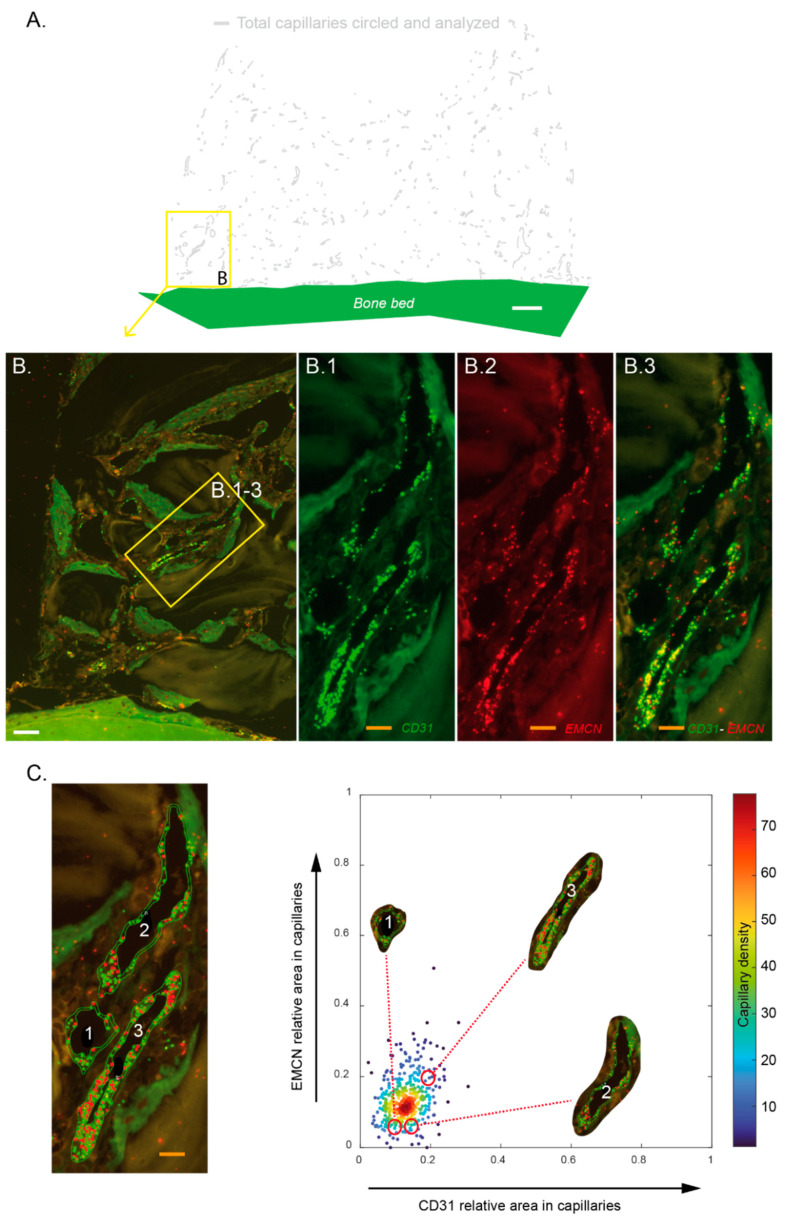
Figure 4.
Assessment of the relative CD31 and EMCN expression in capillaries. Each sample (n = 6 at 2 and 4 weeks) was hybridized with specific probes targeting CD31 and Endomucin (EMCN) mRNA. Resulting slides were entirely scanned by using a fluorescent microscope. Based on morphology and CD31 staining, the whole capillaries were circled and the relative areas of CD31 dots (green)—EMCN (red) within these unitary perimeters was calculated. (A) Representative image of a cylinder’s entire content in which capillaries that were circled are shown on a digital projection that excludes tissues and particles to facilitate observations. White bar: 500 µm (B) magnification of a zone from (A) in which 3 contiguous capillaries are observed and were magnified to visualize CD31 mRNA expression (B.1), EMCN mRNA expression (B.2), and CD31–EMCN mRNA coexpression (B.3). White bar: 100 µm, orange bars: 25 µm. (C) Left: the 3 capillaries from (B) were circled and numerically tagged to facilitate their identification. Orange bar: 25 µm; right: scatter plot of EMCN vs. CD31 relative areas. Each point depicts a capillary belonging to the image shown in Figure 4A. The capillaries are color-coded according to their probability density (smoothed by a kernel density estimator for multivariate data) of having a given CD31 and EMCN relatives areas. These three capillaries show differential CD31–EMCN expression: capillary n°3 exhibits a higher CD31 and EMCN relative areas than the two others.

