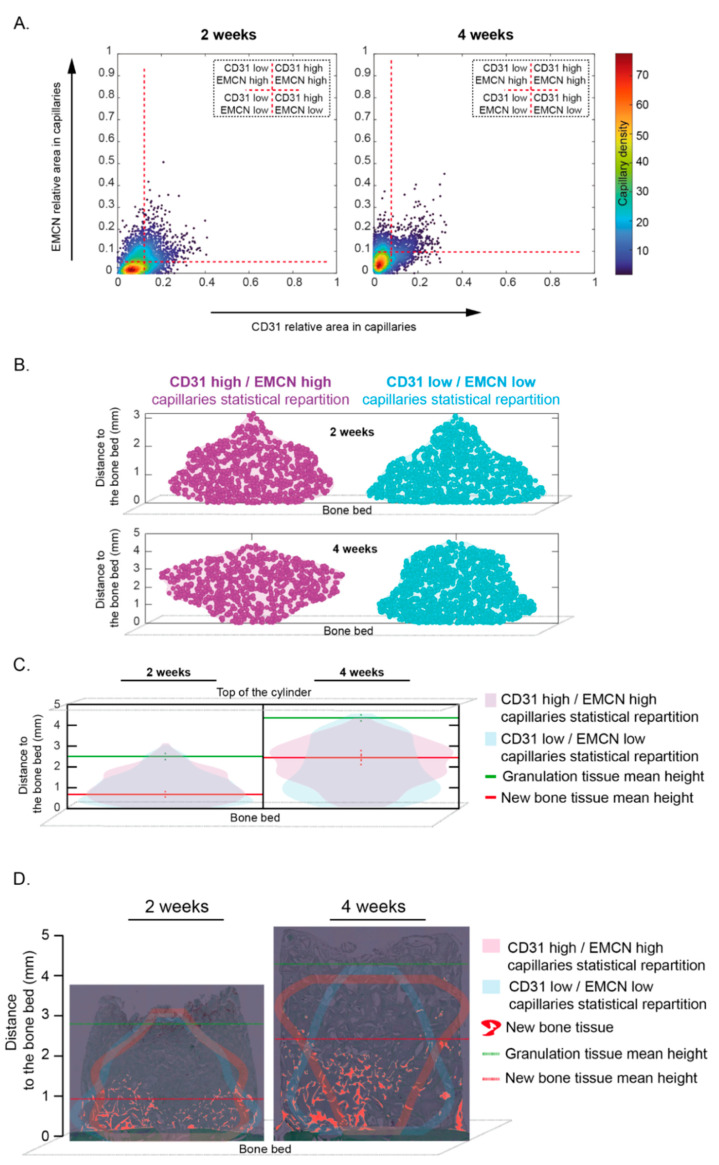
Figure 5.
Capillaries subsets distribution within the cylinder contents at 2 and 4 weeks. (A) Scatter plots of EMCN vs. CD31 relative areas within capillaries for the whole samples at two weeks (left, n = 6) and at four weeks (right, n = 6). Each point is a color-coded capillary for its probability density of having such an EMCN and CD31 relative areas. Horizontal and vertical red dashed lines indicate, respectively, the EMCN and CD31 thresholds used to classify the capillaries in four categories. Thresholds were set in order to have most of the capillary density in the “CD31 Low/EMCN Low” category. (B) “Violin plots” representing the capillaries’ distribution within the whole cylinder content at two weeks (n = 6, top) and four weeks (n = 6, bottom). Purple and blue colors indicate, respectively, the “CD31 High/EMCN High”, and “CD31 Low/EMCN Low” capillaries and the horizontal spreading indicates the probability density of detecting capillaries at a given distance (smoothed by a kernel density estimator). (C) “Violin plots” representing the “CD31 High/EMCN High” (purple) and “CD31 Low/EMCN Low” (blue) capillaries distribution within the whole cylinder content, from the bone bed to the top of the cylinder, superimposed at 2 weeks (left, n = 6) and 4 weeks (Right, n = 6, top). Granulation tissue (green) and new bone tissue (red) mean height +/− sem (dotted vertical lines) were added. Note that the highest proportion of “CD31 High-EMCN High” capillaries was observed in-between the new bone tissue and the granulation tissue, namely within the osteogenic zone, either at 2 or 4 weeks. (D) “Violin plots” contours representing the “CD31 High/EMCN High” (purple) and “CD31 Low/EMCN Low” (blue) capillaries distribution of a representative sample at 2 and 4 weeks were superimposed to the corresponding cylinder contents pictures at 2 and 4 weeks. The same representative sample was conserved from Figure 2A and Figure 3A at 2 weeks and Figure 2B and Figure 3B at 4 weeks. The newly formed bone was highlighted in red. Granulation tissue (green) and new bone tissue (red) mean heights were added. Most of “CD31 High-EMCN High” capillaries were observed in-between the new bone tissue and the granulation tissue, within the osteogenic zone, either at 2 or 4 weeks. On the other hand, the largest proportion of “CD31 Low-EMCN Low” capillaries was observed in the new bone tissue, within the remodeling zone. Distance distribution was compared using a two-sample Kolmogorov–Smirnov test: at two weeks p-value~0.008 and at four weeks p-value << 0.001. Thus, the distance from the bone bed to the “CD31 High/EMCN High” and “CD31 Low/EMCN Low” capillaries appear not to follow the same continuous distribution either at 2 or 4 weeks.

