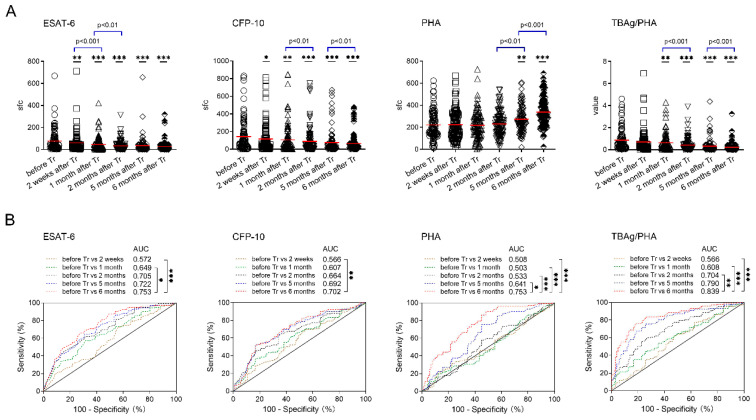
Figure 2.
T-SPOT results in patients with successful treatment outcomes. (A) Dot plots showing ESAT-6 sfc, CFP-10 sfc, PHA sfc, and the TBAg/PHA ratio in patients before and after different time points (2 weeks, 1 month, 2 months, 5 months, 6 months) of TB treatment. Bars indicate means (* p < 0.05, ** p < 0.01, and *** p < 0.001, compared with before treatment). (B) Receiver operating characteristic analysis was performed for ESAT-6 sfc, CFP-10 sfc, PHA sfc, and the TBAg/PHA ratio to determine threshold values for distinguishing between before treatment and after different time points of treatment. * p < 0.05, ** p < 0.01, and *** p < 0.001. ESAT-6, early secreted antigenic target 6; CFP-10, culture filtrate protein 10; PHA, phytohemagglutinin; sfc, spot-forming cells. TBAg/PHA, the ratio of TB-specific antigen to phytohemagglutinin. Tr, treatment.

