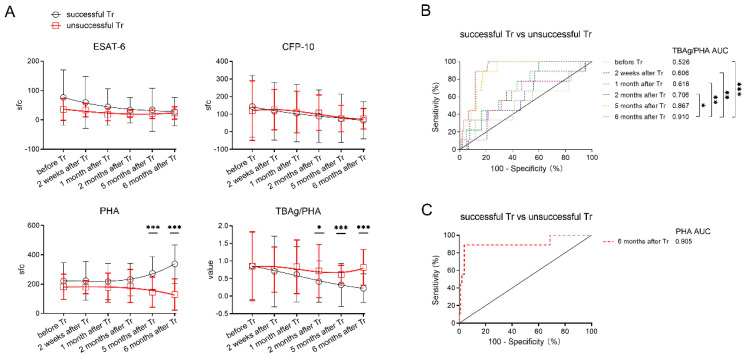
Figure 4.
Comparing T-SPOT results between patients with successful and unsuccessful treatment outcomes. (A) Dynamic analysis of the T-SPOT results in patients with successful and unsuccessful treatment outcomes. Data in each time point are expressed as mean ± SD (* p < 0.05, *** p < 0.001, between patients with successful and unsuccessful treatment outcomes in each time points). The smoothing cubic splines were fitted to the values of different parameters to summarize the overall trend. (B) Receiver operating characteristic analysis was performed for the TBAg/PHA ratio and (C) PHA to determine threshold values for distinguishing between patients with successful and unsuccessful treatment outcomes (* p < 0.05, ** p < 0.01, *** p < 0.001). ESAT−6, early secreted antigenic target 6; CFP−10, culture filtrate protein 10; PHA, phytohemagglutinin; sfc, spot-forming cells. TBAg/PHA, the ratio of TB-specific antigen to phytohemagglutinin; Tr, treatment.

