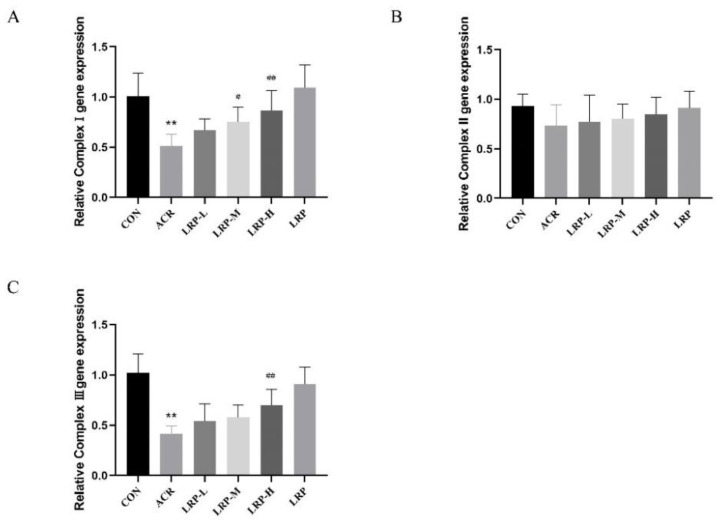
Figure 4.
Effect of LRP on the mRNA expression of mitochondrial complexes I (A), II (B), III (C) induced by ACR in liver tissue. Data are expressed as mean ± SD. ** p < 0.01 versus the CON group; # p < 0.05 and ## p < 0.01 versus the ACR group. ACR, acrylamide; LRP-L, Lycium ruthenicum polyphenols in low dosage; LRP-M, Lycium ruthenicum polyphenols in medium dosage; LRP-H, Lycium ruthenicum polyphenols in high dosage; LRP, Lycium ruthenicum polyphenols control group.

