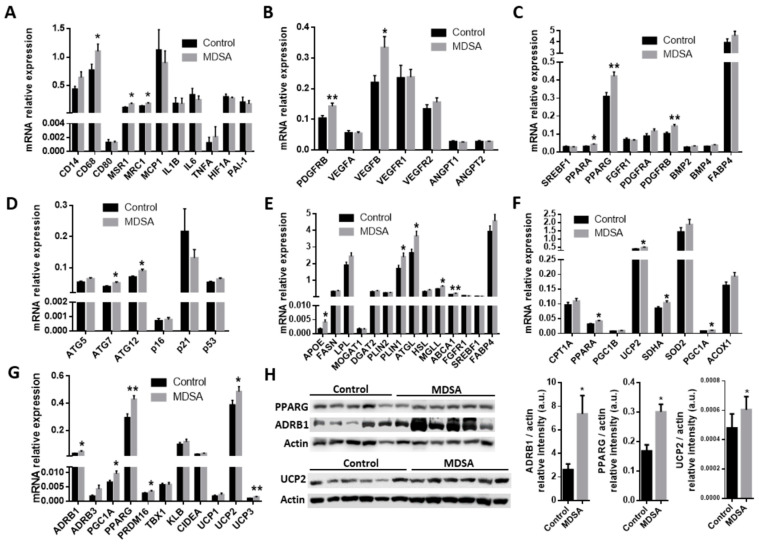
Figure 3.
MDSA-mediated modulation of gene expression levels in VAT. Relative mRNA expression at study conclusion of genes related to: (A) inflammation, (B) angiogenesis, (C) adipogenesis, (D) autophagy and senescence, (E) fatty acid metabolism, (F) mitochondrial function and FAO, and (G) beiging. (H) Western blot analysis and optical density quantification of PPARG (57 kDa), ADRB1 (50 kDa) and UCP2 (36 kDa) contents relative to actin (40 kDa). Data are shown as average ± SD and compared to controls by Student’s t-test or Mann–Whitney U test for non-normally distributed data and corrected for multiple comparisons using the Holm–Sidak method. * = p < 0.05; ** = p < 0.01.

