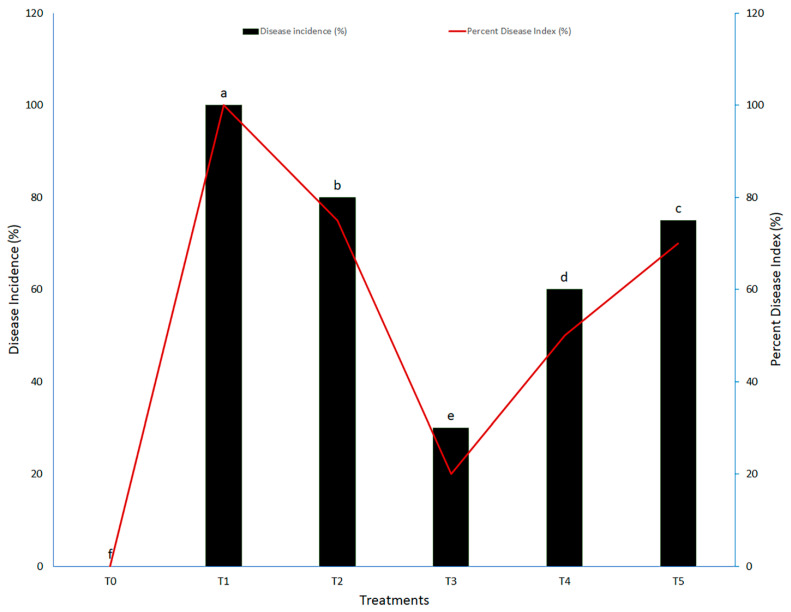
Figure 2.
Disease incidence and percent disease index of wheat plants infected with Puccinia striiformis. Treatments: T0: control (healthy wheat plants), T1: plants infected with pathogen (Puccinia striiformis) only, T2: plants infected with pathogen + 20 mg L−1 TiO2 NPs, T3: plants infected with pathogen + 40 mg L−1 TiO2 NPs, T4: plants infected with pathogen + 60 mg L−1 TiO2 NPs; T5: plants infected with pathogen + 80 mg L−1 TiO2 NPs. Different small letters indicate significant differences in results (p < 0.05).

