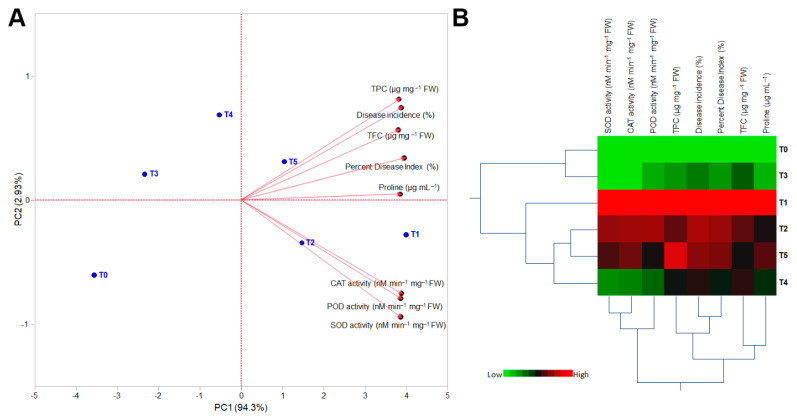
Figure 4.
Principal component analysis (PCA) and two-way hierarchical cluster analysis (HCA) of wheat plants inoculated with Puccinia striiformis and treated with different concentrations of TiO2 NPs in association with biochemical parameters, disease incidence, and percent disease index. (A) PCA-associated scatter plots and loading plots (Biplot), and (B) two-way HCA. The heat map visualizes variations. Rows correspond to the TiO2 NPs treatments, whereas columns correspond to different measured parameters. Treatments: T0: control (healthy wheat plants), T1: plants infected with pathogen (Puccinia striiformis) only, T2: plants infected with pathogen + 20 mg L−1 TiO2 NPs, T3: plants infected with pathogen + 40 mg L−1 TiO2 NPs, T4: plants infected with pathogen + 60 mg L−1 TiO2 NPs, and T5: plants infected with pathogen + 80 mg L−1 TiO2 NPs. The heat map is colored according to numerical values, where low values are green and high values are red.

