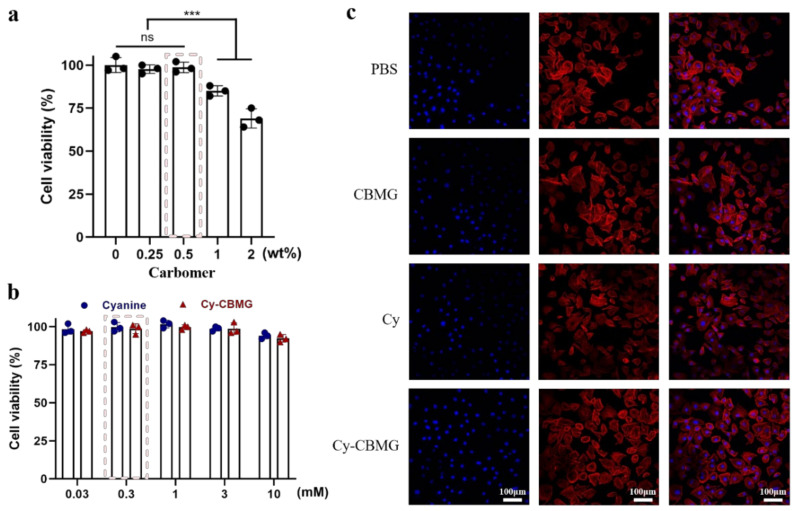
Figure 2.
Biocompatibility assessment for Cy, CBMG and Cy-CBMG. (a) Cell viability after incubated at various concentrations of carbomer (0.25, 0.5, 1, 2 wt%). (b) Cell viability after incubated with various concentrations of Cy and Cy-CBMG (0.03, 0.3, 1, 3 mM). (c) Cytoskeleton staining of HUVECs co-incubated with PBS, CBMG (0.5 wt%), Cy (0.3 mM), and Cy-CBMG (0.3 mM). ns: no significance, p > 0.05; ***: a statistically significant difference between groups, p < 0.001.

