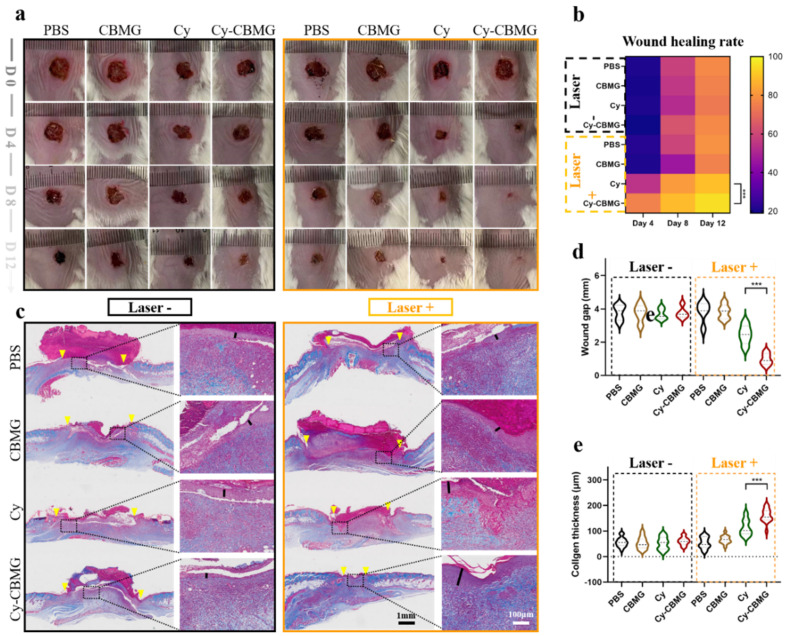
Figure 6.
Wound healing evaluation after various treatments. (a) Representative wound area on day 0, 4, 8, 12. (b) The relative wound healing rate (n = 5). (c) Representative Masson’s trichrome staining in wound tissues. The wound gap was measured as the distance between two yellow arrows in a typical histological section. (d) Statistical analysis of wound gap (n = 5). (e) Analysis of collagen thickness, as measured upon the black line in histological sections, as showed in (c) (n = 5 × 3). ***: a statistically significant difference between groups, p < 0.001.

