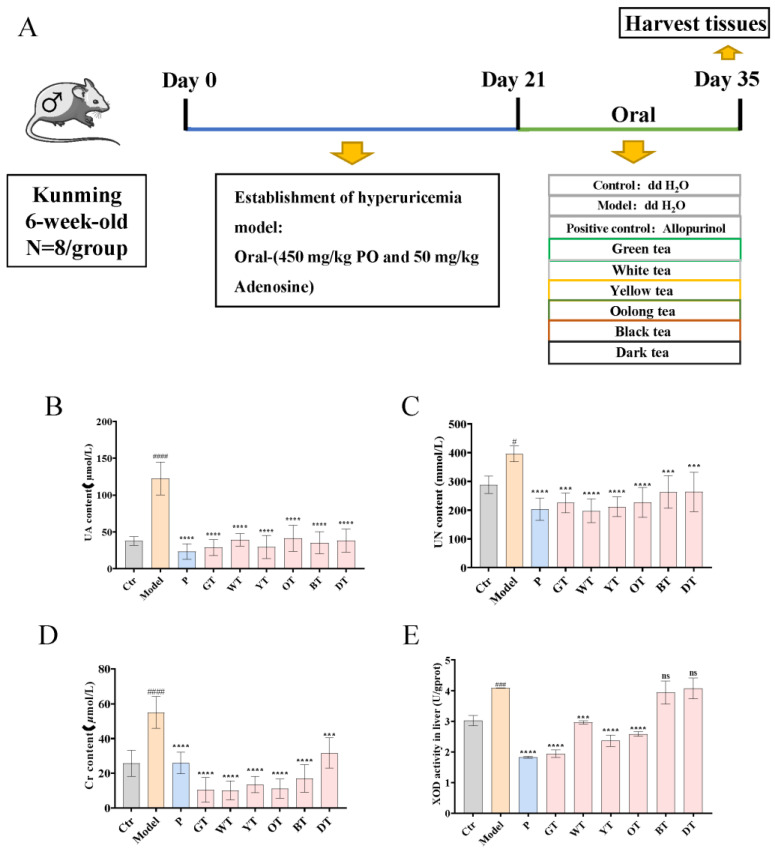
Figure 1.
Effects of TWEs on UA-related indexes and antioxidant levels in HUA mice. (A) Study design for the whole experiment; (B) Serum UA levels. (C) Serum UN levels. (D) Serum Cr levels. (E) Liver XOD activity. The data are expressed as mean ± SD. # p < 0.1, ### p < 0.001, #### p < 0.0001 were compared with the control, ns p > 0.1, *** p < 0.001, **** p < 0.0001 were compared with the model.

