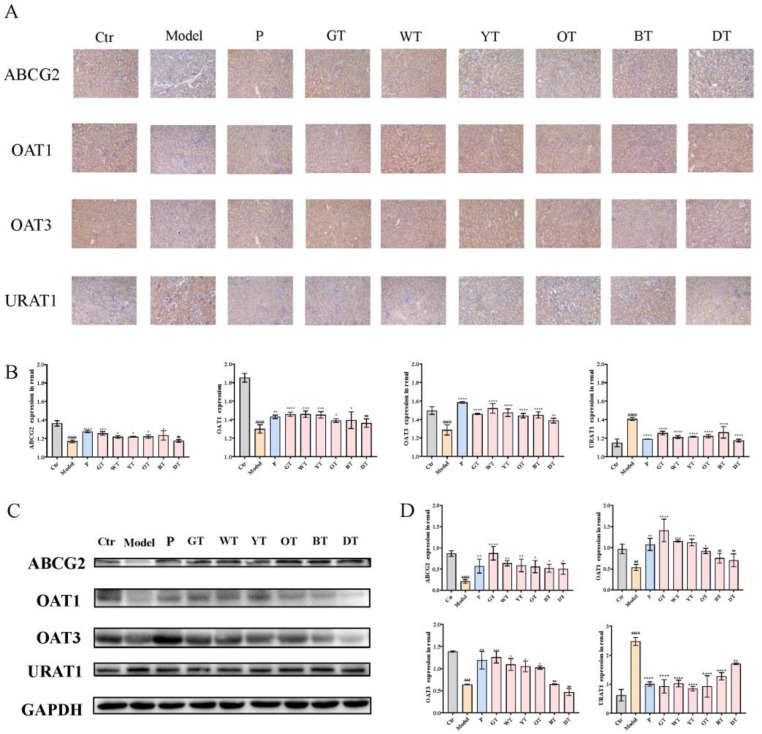
Figure 4.
Mechanism of TWEs on UA metabolism in kidney. (A) Immunohistochemical staining of uric acid transporters in the kidney (200×). (B) T bar graphs show the positive rates of ABCG2, OAT1, OAT3, and URAT1 proteins in the kidney. (C) Representative immunoblots of ABCG2, OAT1, OAT3, and URAT1 protein expression in the kidney. (D) Quantification of ABCG2, OAT1, OAT3, and URAT1 expression levels. The data are expressed as mean ± SD. ## p <0.01, ### p < 0.001, #### p < 0.0001 were compared with the control, ns p > 0.1, * p < 0.1, ** p < 0.01, *** p < 0.001, **** p < 0.0001 were compared with the model.

