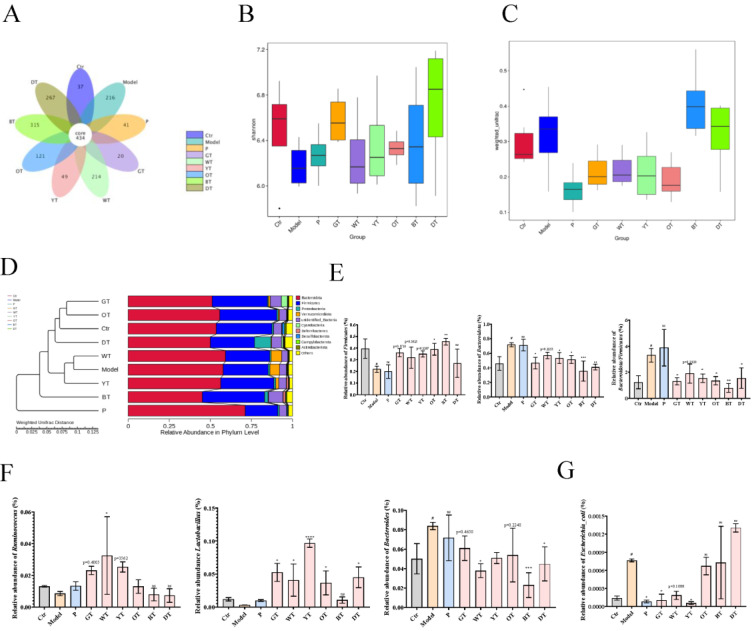
Figure 7.
Effects of TWEs on gut microbiota in HUA mice. (A) Venn diagram showing species composition in nine groups. (B) Shannon index analysis of alpha diversity of nine taxa species’ intergroup difference analysis. (C) Boxplots based on weighted UniFrac beta diversity of nine taxa species. (D) Weighted UniFrac distance-based UPGMA clustering tree for nine taxa species at the phylum level. (E) Relative abundance of Firmicutes, Bacteroidota, and Firmicutes/Bacteroidota in nine taxa species at the phylum level. (F) Relative abundance of Ruminococcus, Lactobacillus, and Bacteroides in nine taxa species at the genus level. (G) Relative abundance of Escherichia coli in nine taxa species at the genus level. The data are expressed as mean ± SD. # p < 0. 1 was compared with the control, ns p > 0.1, * p < 0.1, ** p < 0.001, *** p < 0.001, **** p < 0.0001 were compared with the model.

