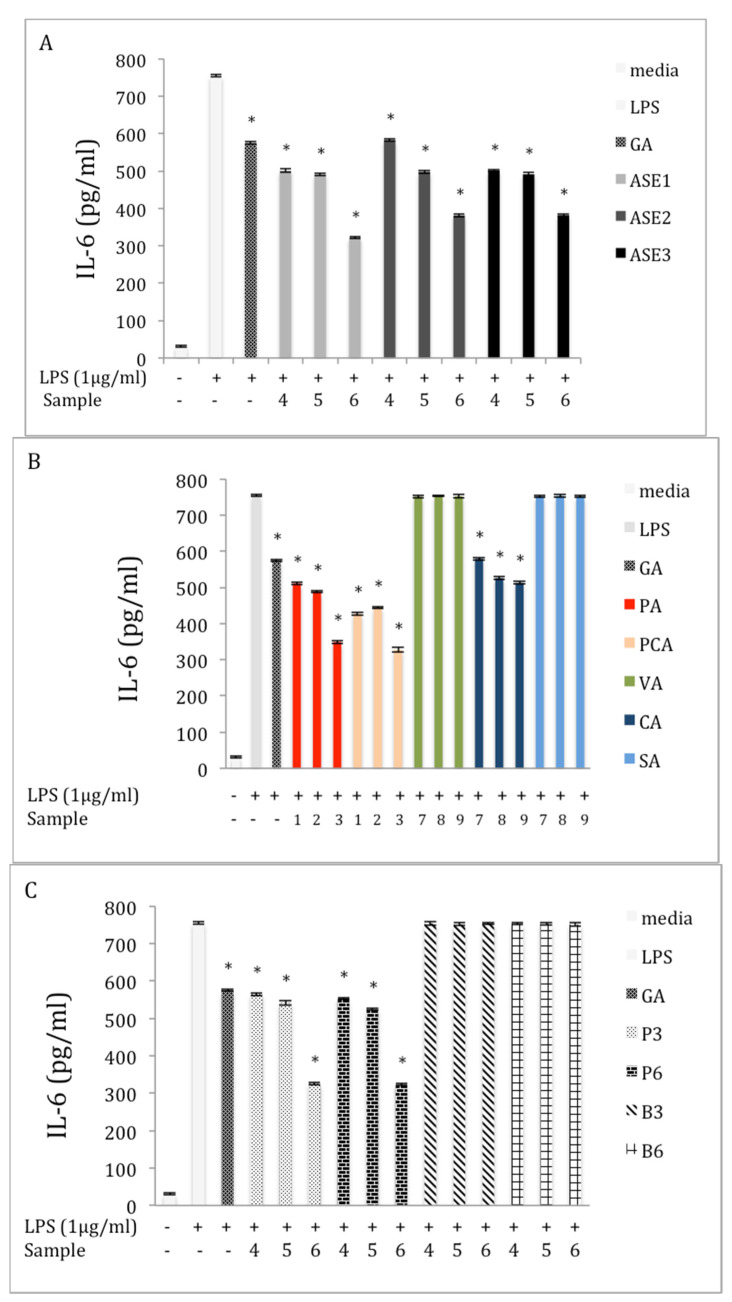
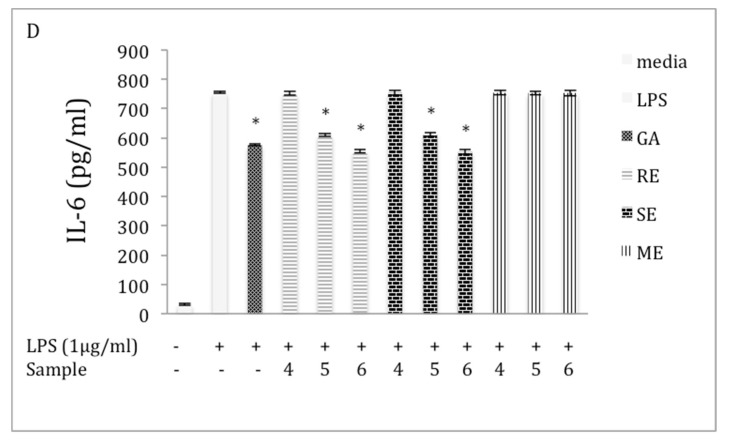
Figure 4.
Effect of extracts and phenolics on IL-6 expression in macrophage RAW 264.7 cells (A) extracts obtained by ASE; (B) pure phenolic acid standards; (C) crude polysaccharide extracts; and (D) different extraction methods. Cells were cultured in the absence or presence of LPS (1 μg /mL) with various concentrations of different samples for 24 h (0 = media; GA = 2 μM; 1 = 5 μM; 2 = 10 μM; 3 = 20 μM; 4 = 50 μg/mL; 5 = 100 μg/mL; and 6 = 150 μg/mL; 7 = 25 μM; 8 = 50 μM; and 9 = 100 μM). IL-6 production was determined through an ELISA. The data represent the mean ± SD of triplicate experiments. Statistical significance p < 0.05 (*) was determined using one-way analysis of variance for independent means, followed by Tukey’s HSD test.


