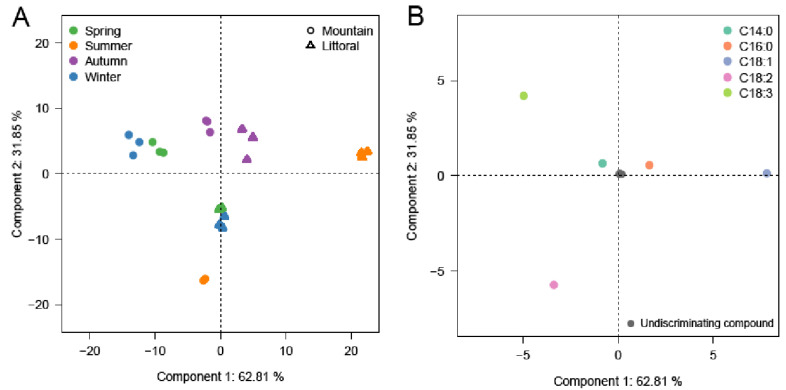
Figure 2.
PCA analysis of the FAMEs from the leaf acyl lipids of Pistacia lentiscus leaf samples collected at the two altitude sites (△ for littoral versus ◯ for mountain) and 4 consecutive seasons: (A) score plot of the PC1 versus PC2 scores; (B) loading plot of PC1- and PC2-contributing FAME compounds (the most discriminating compounds are represented in color).

