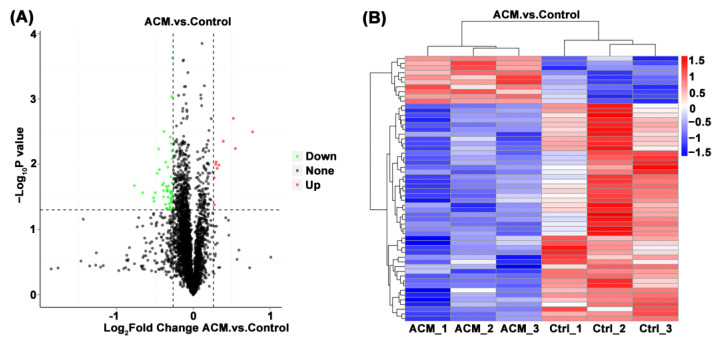
Figure 3.
(A) Volcano plot of the myocardial proteomics data of the control group and the ACM group. DEPs are demonstrated in the volcano map. The abscissa is the logarithm of the protein difference multiple with 2 as the base, and the ordinate is the absolute value of the logarithm of the p value with 10 as the base. Black dots represent proteins that are not significantly different, and red and green represent up-regulated and down-regulated proteins, respectively. (B) Heat map of the differentially expressed metabolites between the control group and the ACM group. The up-regulation and down-regulation proteins among different samples are revealed by cluster analysis. Each row is adjusted for Z value, (observed value-row mean)/row standard deviation. Red and blue represent up-regulation and down-regulation, respectively.

