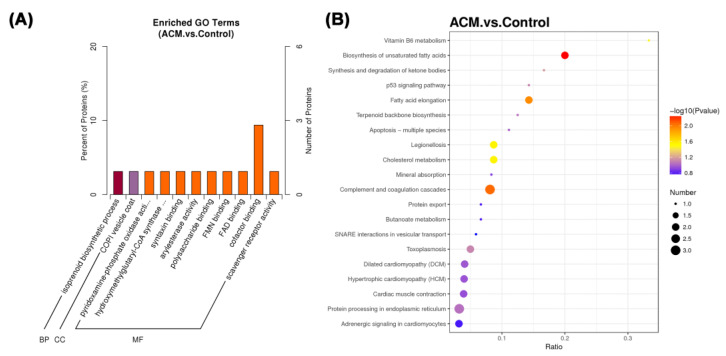
Figure 4.
(A) Functional enrichment of GO annotation for DEPs. BP: biological process, CC: cellular component, and MF: molecular function. (B) The KEGG pathway enrichment analysis of different groups between the control group and the ACM group. The ratio of the number of differential proteins to the total number of proteins identified is the abscissa. From blue to red dots, it means that the adjusted p value is increasing from large to small, and the degree of enrichment is becoming more and more significant. The size of the dots represents the number of genes enriched in this pathway.

