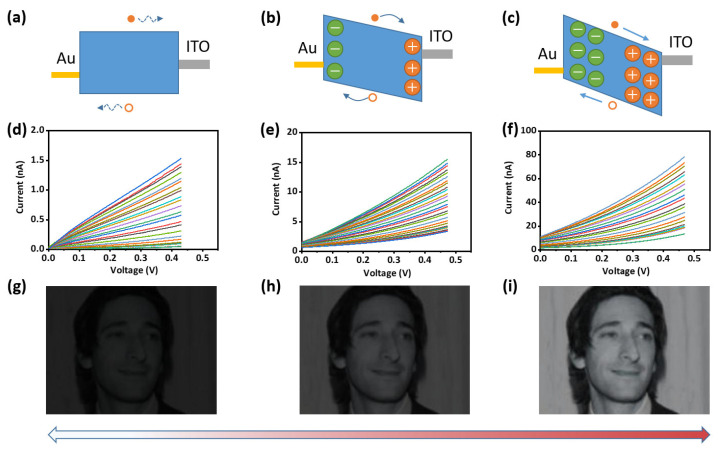
Figure 3.
(a–c) Schematic diagram of energy band structure in different ion distribution states of perovskite; (d–f) I–V curves of the ITO/CsFAMA/Au photodetector under white light irradiation with different optical intensity through applying 1 V bias for (d) 0 s; (e) 40 s; (f) 80 s; (g–i) imaging simulation results of CsFAMA photosensitive array under different photoresponsivity. This figure is from labeled faces in the wild home (LFW) (http://vis-www.cs.umass.edu/lfw/, accessed on 20 March 2022).

