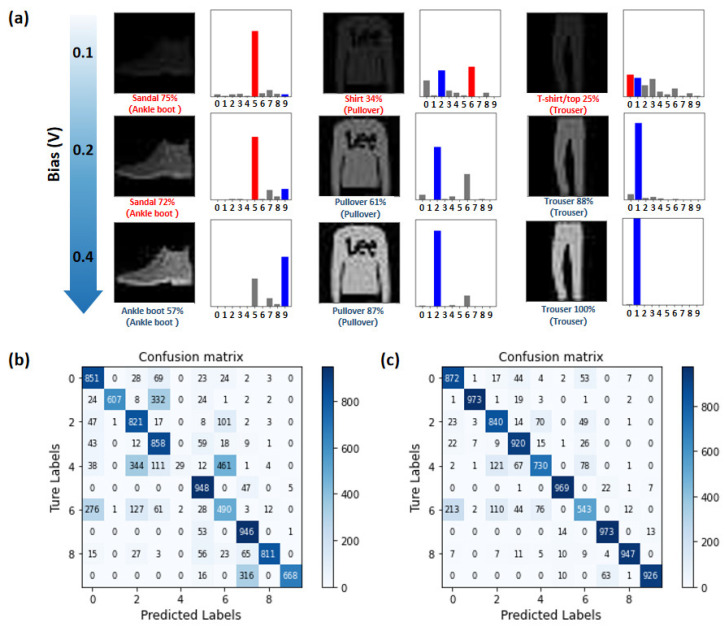
Figure 5.
(a) The relationship between imaging results and recognition accuracy under different bias readout voltages. The images are adapted with permission from [25]; (b,c) confusion matrix diagram of the in-sensor computing neural network at 0.1 V and 0.4 V bias voltage, respectively.

