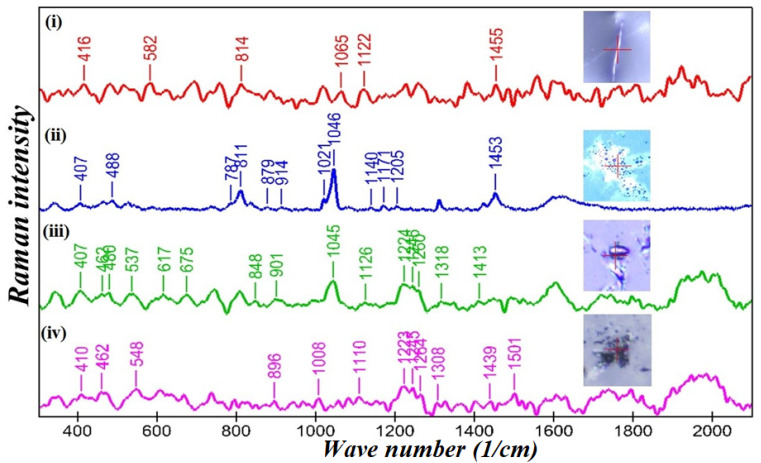
Figure 9.
Comparison of the surface enhanced Raman spectra of Rhizopus arrhizus sporangiospores treated with PEI-f-Ag-NPs for 24 h. (i) Raman spectrum of mycelium, (ii) SERS spectrum of freshly harvested sporangiospores, (iii) SERS spectrum of sporangiospores incubated with PEI-f-AgNP-1, and (iv) SERS spectrum of sporangiospores incubated with PEI-AgNP-2 with corresponding confocal Raman microscopic photographs (inset). Band peaks are assigned for matched biomolecules.

