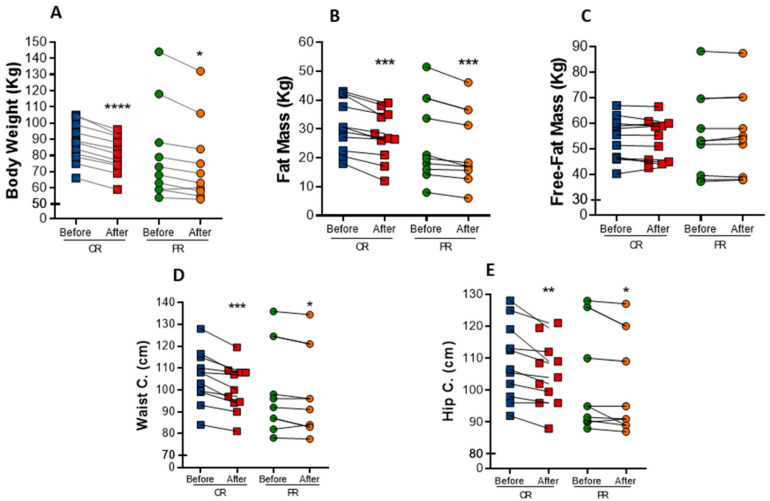
Figure 1.
Anthropometric changes after caloric restriction (CR) or protein restriction (PR). (A) Body weight (**** p = < 0.0001 and * p = 0.0176). (B) Fat mass comparing before and after caloric or protein restriction (*** p = 0.0010 and ** p = 0.0033). (C) Free-fat mass comparing before and after caloric or protein restriction ( p = 0.7929 and p = 0.6464). (D) Waist circumference comparing before and after caloric or protein restriction (*** p = 0.0009 and * p = 0.0325). (E) Hip circumference comparing before and after caloric or protein restriction (** p = 0.0091 and * p = 0.0383). Data are presented in dot-plot format. ANOVA mixed-design analysis of variance was performed.

