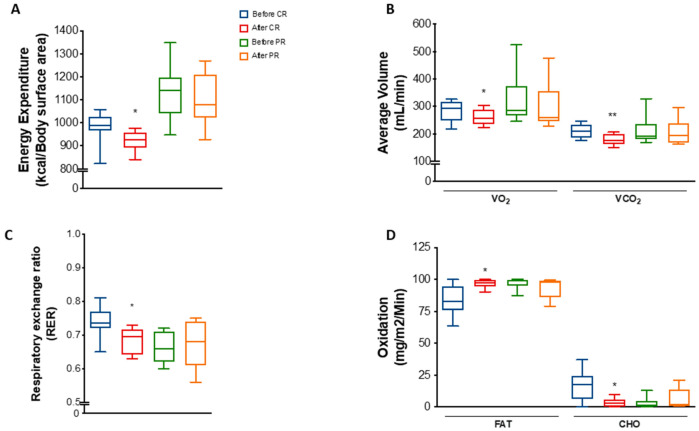
Figure 2.
Energy expenditure and substrate utilization after caloric restriction (CR) or protein restriction (PR). Data obtained using indirect calorimetry. (A) Energy expenditure before and after CR (* p = 0.0311) and before and after PR (ns p = 0.7568). (B) Average volume of VO2 and VCO2 before and after CR (* p = 0.0126 and ** p = 0.0051) and before and after PR (ns p = 0.2736 and ns p = 0.5507). (C) RER (respiratory exchange ratio) before and after CR (* p = 0.0296) and before and after PR (ns p = 0.8571). (D) Lipid (FAT) and carbohydrate (CHO) oxidation before and after CR (* p = 0.0454 and * p = 0.0452) and before and after PR ( p = 0.4281 and p = 0.4270). Data are shown in box plot format. ANOVA mixed-design analysis of variance was performed.

