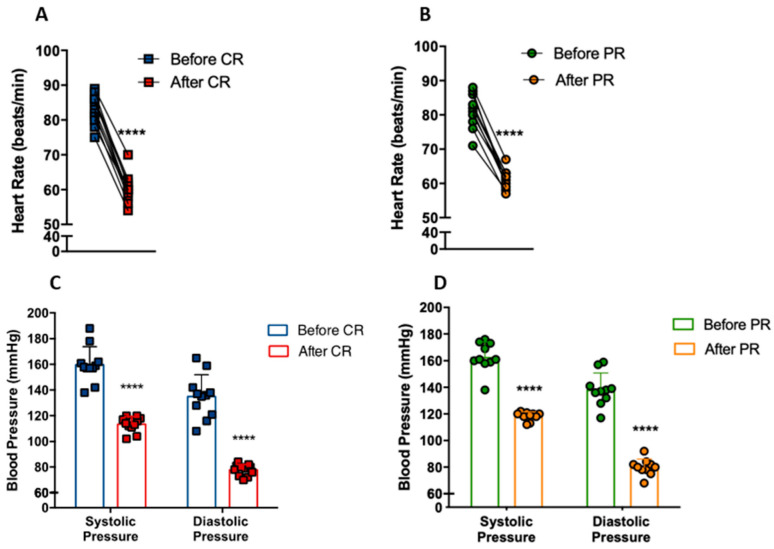
Figure 3.
Reduction of cardiovascular disease risk factors after caloric restriction (CR) or protein restriction (PR). (A) Heart rate at rest before and after caloric restriction (**** p = < 0.0001). (B) Heart rate at rest before and after protein restriction (**** p = < 0.0001). (C) Blood pressure before and after caloric restriction (**** p = < 0.0001). (D) Blood pressure before and after protein restriction (**** p = < 0.0001). Data are presented in dot-plot format. Paired t-test was performed.

