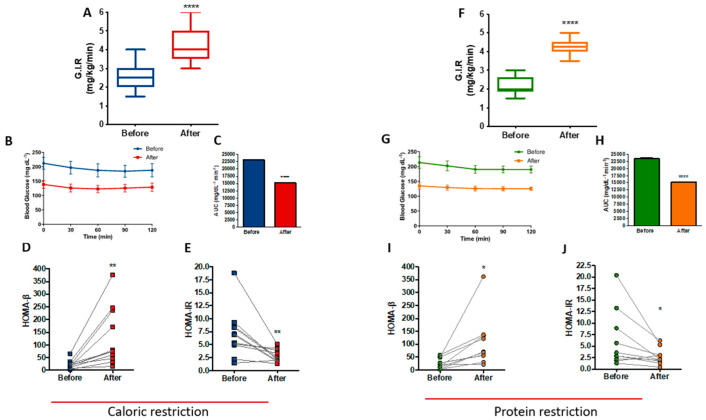
Figure 5.
Improved insulin sensitivity after caloric restriction (CR) or protein restriction (PR). Results obtained using hyperinsulinemic-euglycemic clamp or HOMA-β and HOMA-IR. (A) Glucose infusion rate (GIR) comparing before and after caloric restriction (**** p = < 0.0001). (B) Glycemic curve during the clamp. (C) Area under the curve of B (**** p = < 0.0001). (D) HOMA-β comparing before and after caloric restriction (** p = 0.0056). (E) HOMA-IR comparing before and after caloric restriction (** p = 0.0057). (F) GIR comparing before and after protein restriction (**** p = < 0.0001). (G) Glycemic curve during the clamp. (H) Area under the curve of G (**** p = < 0.0001). (I) HOMA-β comparing before and after protein restriction (* p = 0.0199). (J) HOMA-IR comparing before and after protein restriction (* p = 0.0460). Data are shown in box plot and dot plot format. Paired t-test was performed.

