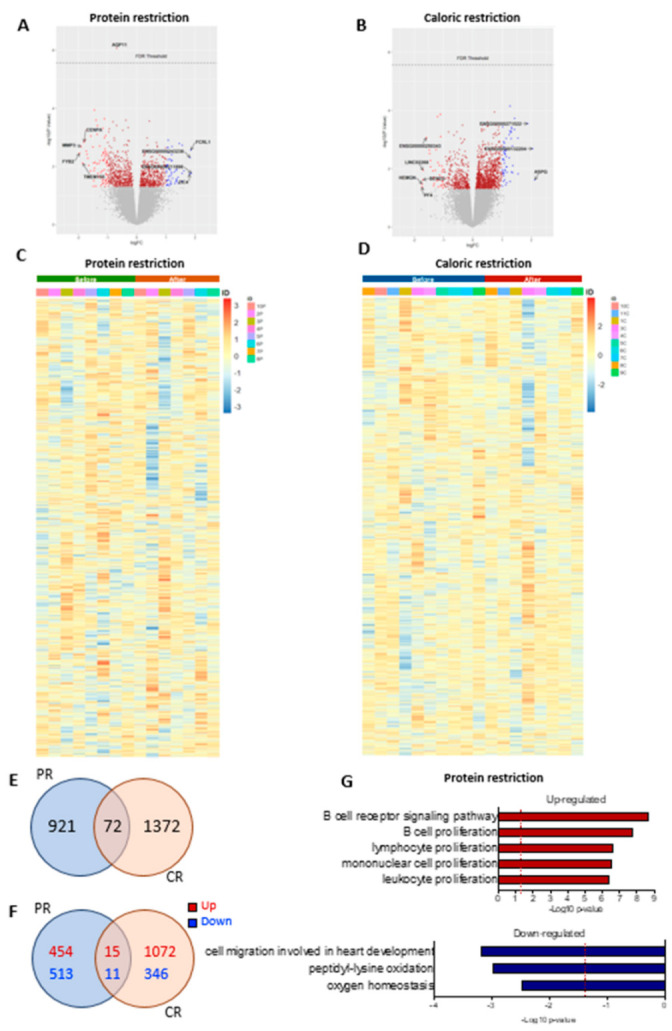
Figure 6.

Differential gene expression after protein restriction (PR) or caloric restriction (CR). Volcano plots (log2 fold change against −log10 of the p-value) showing distribution of differentially expressed of the ~24,000 transcripts (A) before and after PR, and (B) before and after CR. Heatmap representation of gene expression (upregulation in red and downregulation in blue) of the individual samples comparing before and after PR (n = 8) (C), and before and after CR (n = 10) (D). Venn diagrams of adipose tissue and overlapping genes regulated by PR or CR: (E) total genes, (F) up- and downregulated genes; p-value < 0.05. GO terms enriched in genes upregulated and downregulated in adipose tissue after PR (G).
