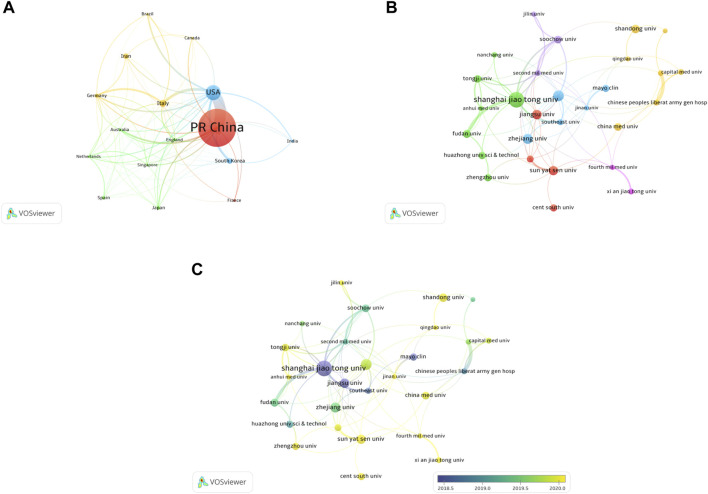
FIGURE 3.
Co-authorship analysis of countries and institutions. (A) Network map of co-authorship between countries with more than 15 publications. (B) Network map of co-authorship between institutions with more than 15 publications. (C) Network map of co-authorship between institutions with more than 15 publications according to average publication year (blue: earlier, yellow: later).

