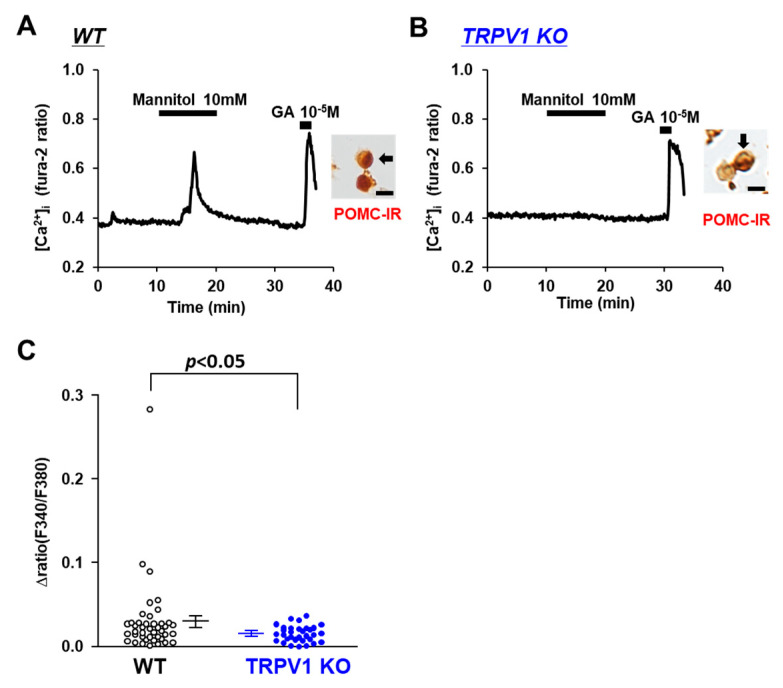
Figure 4.
Mannitol increased [Ca2+]i in single POMC neurons in ARC. (A,B) Typical example of [Ca2+]i responses to mannitol and 10−5 M glutamate (GA) in POMC neurons isolated from wild-type (WT) mice (A) and TRPV1 KO mice (B). Scale bar is 20 μm. (C) Average amplitude of [Ca2+]i responses to mannitol (Δratio) in POMC neurons. Data are presented as mean ± SEM. WT vs. KO determined by one-way ANOVA followed by the Bonferroni test.

