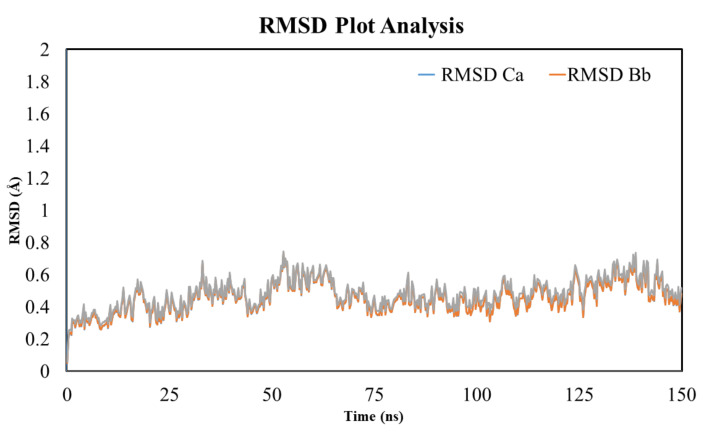
Figure 8.
The MD simulation analysis using the root mean square deviation (RMSD) plot. The MD simulation was performed to assess the RMSD value of the TLR-4 and rutin complex for 150 ns. The MD simulation analysis showed a RMSD score within the acceptable range and no significant deviation was observed.

