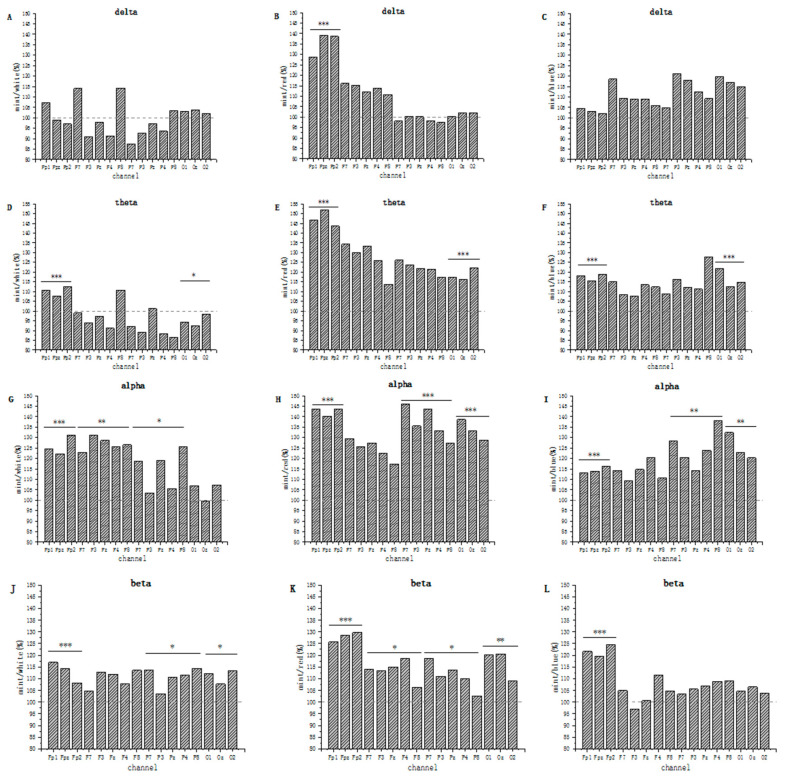
Figure 2.
Single-channel analysis comparison graph for each group, comparing bands of the same channel in the same colour with or without PEO inhalation. (A,D,G,J) are white groups, (B,E,H,K) are red groups, and (C,F,I,L) are blue groups (p-values: * < 0.05, ** < 0.001, *** < 0.0001. Relevant data can be found in supplementary materials.).

