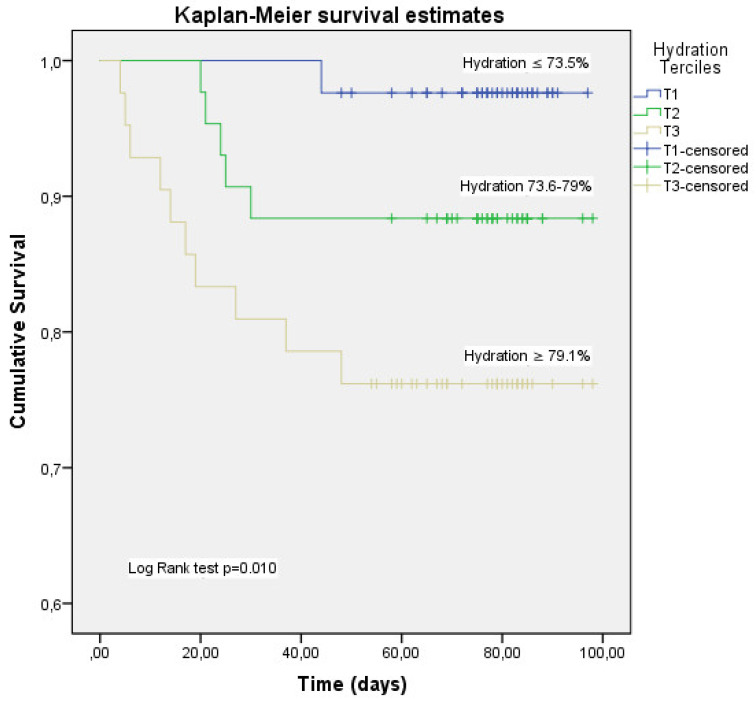
Figure 2.
Kaplan–Meier analysis for the cumulative percentage of surviving patients at 90 days according to hydration percentage tertiles. The 33rd and 66th percentiles of hydration percentage were used as the cut-off point to divide the patients with acute COVID-19 disease into 3 groups (T1, T2, T3) and made the Kaplan–Meier plot. Kaplan–Meier product-limit estimator shower that higher hydration (T3) was significantly linked with higher mortality rates (log-rank test, p = 0.010). Mortality was mainly concentrated in T3.

