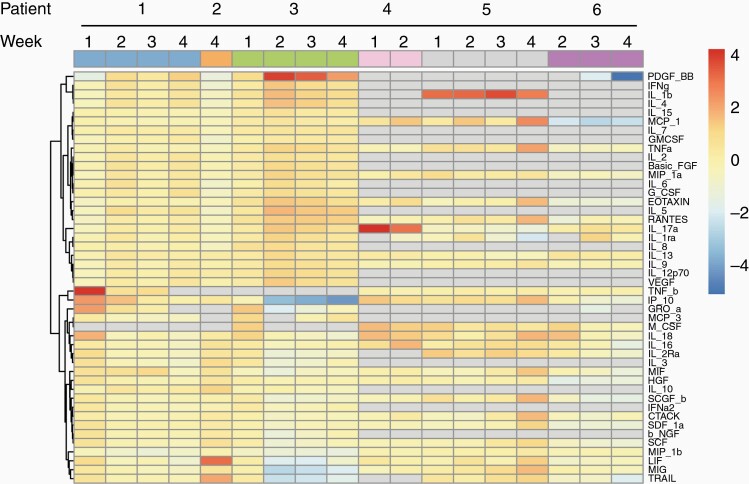
Figure 3.
Clustering analysis of serial cytokine studies. Serum samples from patients were drawn at baseline and weekly throughout cycle one. Cytokine levels were acquired by Luminex Multiplex Assay. Levels from weeks 1 to 4 were normalized to baseline values if available, and log2 transformed for clustering via the pheatmap function in RStudio. Gray boxes represent missing data. Column clustering color labeled by Patient (top line) and Week (bottom line) to aid in visualization.

