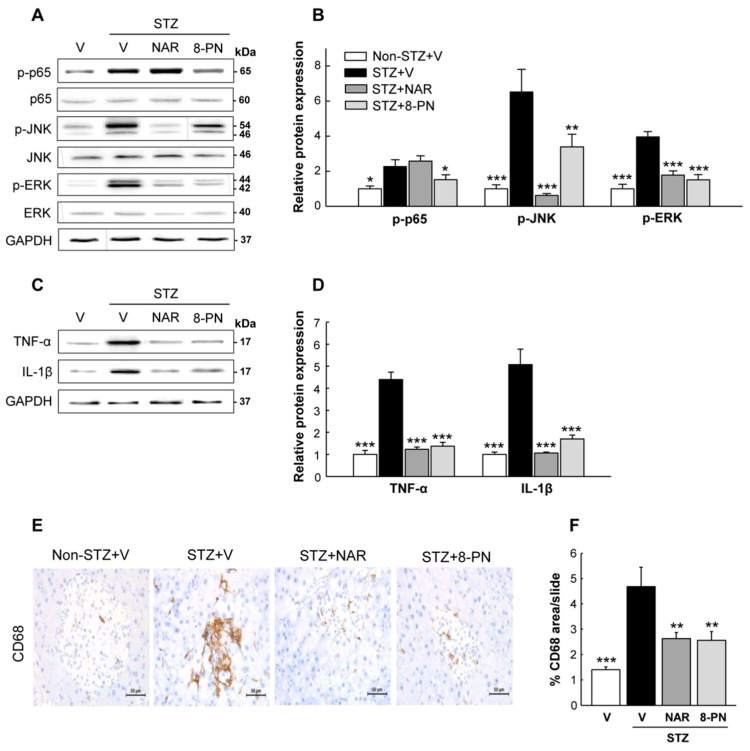
Figure 4.
Inhibitory effects of naringenin and 8-PN on macrophage infiltration and inflammatory signaling in the pancreas. (A) Representative Western blot images of phospho-p65, p65, phospho-JNK, JNK, phospho-ERK, and ERK in the pancreas and (B) corresponding quantitative data. (C) Representative Western blot images of TNF-α and IL-1β in the pancreas and (D) corresponding quantitative data. (E) Pancreas DAB staining for CD68+ macrophages (×400). (F) Quantitative data of macrophage infiltration were calculated by dividing the area of target signal by the total area. Data are shown as means ± SEM (n = 6 for (A–D) and n = 4 for (E,F)). * p < 0.05, ** p < 0.01, *** p < 0.001 vs. STZ-vehicle group.

