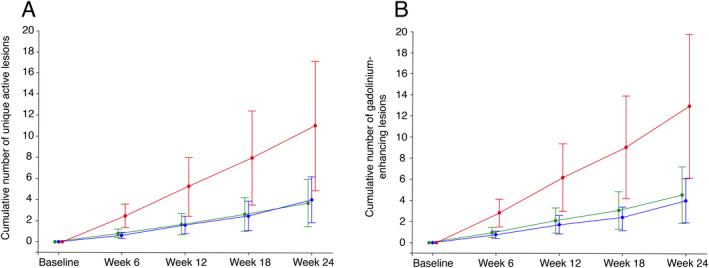
Figure 2.

Cumulative number of combined unique active lesions (A) and gadolinium‐enhancing lesions (B) from baseline to Week 24 (intention‐to‐treat population). Red: placebo (n = 69); green: vidofludimus calcium 30 mg (n = 71); blue: vidofludimus calcium (n = 69). Data are presented as adjusted mean with the upper and lower limits of the 95% CIs. MRI = magnetic resonance imaging. Estimates were adjusted for baseline volume of T2 lesions, MRI field strength (1.5 or 3.0 Tesla), and baseline number of gadolinium‐enhancing lesions (0 or ≥1) using a generalized linear model with a negative binomial distribution and a logarithmic link function. [Colour figure can be viewed at wileyonlinelibrary.com]
