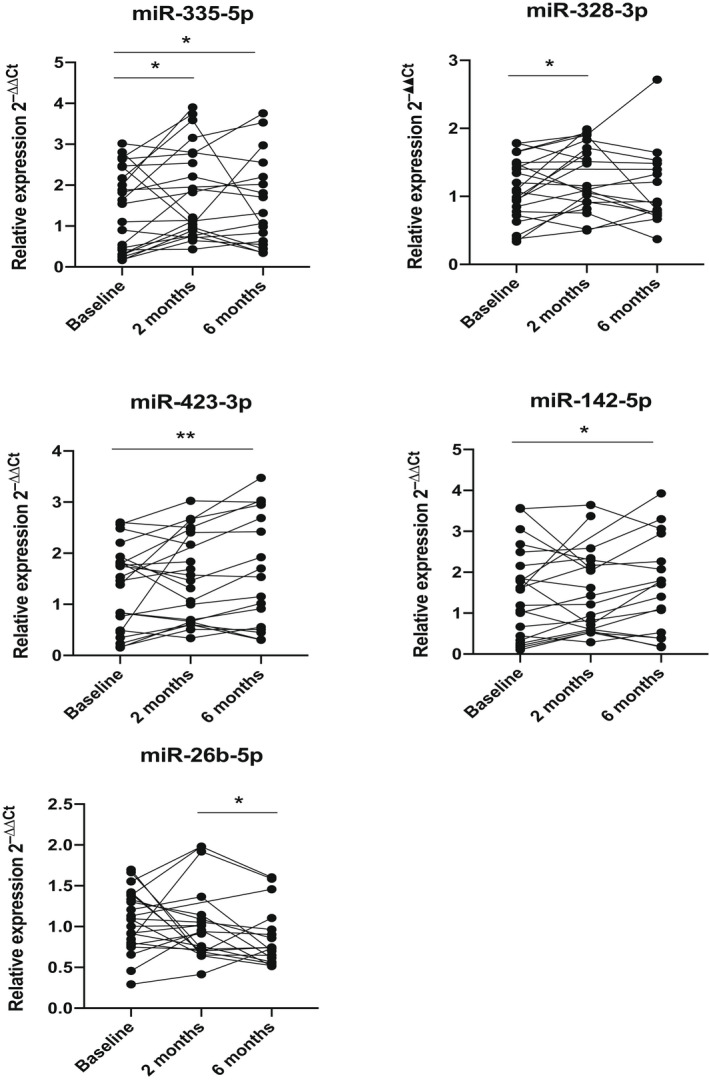
Figure 5.

Relative expression of the analysed microRNAs in plasma samples from SMA type 1 patients at pre‐treatment, 2 and 6 months after nusinersen treatment. pvalues derived from the Wilcoxon matched‐pairs t test are presented with * and ** and correspond to p < 0.05 and p < 0.01 respectively. SMA, spinal muscular atrophy.
