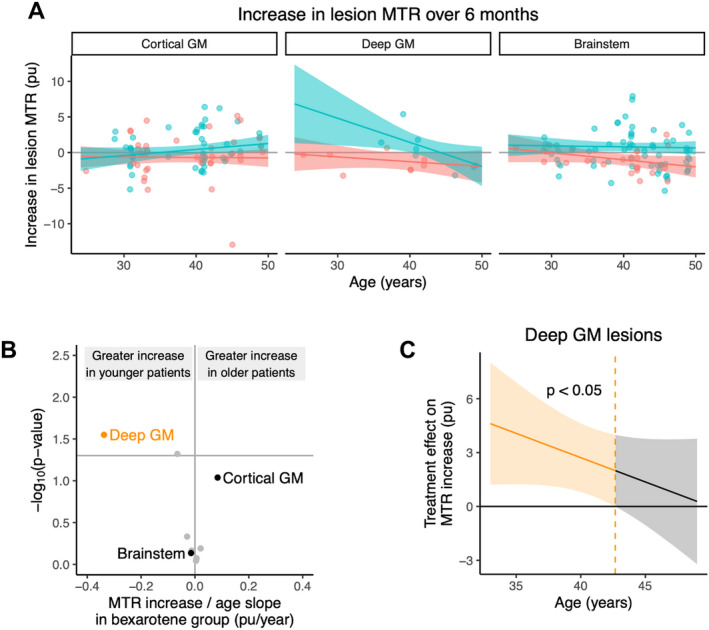
Figure 2.

(A) Variation of lesion MTR increase (improvement) with patient age for the three regions with statistically significant increases in MTR. 8 The bexarotene group is shown in blue and placebo in red. Each data point represents a lesion, with superimposed horizontal jitter to better visualize lesions with the same patient age. The model fit with 95% confidence interval is shown. (B) Volcano plot showing the effect of age on lesion MTR improvement within the bexarotene group for the locations plotted in (A). Other brain regions are shown in gray for comparison. (C) Treatment effect (bexarotene vs. placebo) for deep gray matter lesions as a function of age. The region to the left of the dashed line shows the age range at which there is a significant treatment effect with type 1 error rate (α) = 0.05. GM = gray matter, MTR = magnetization transfer ratio. [Colour figure can be viewed at wileyonlinelibrary.com]
