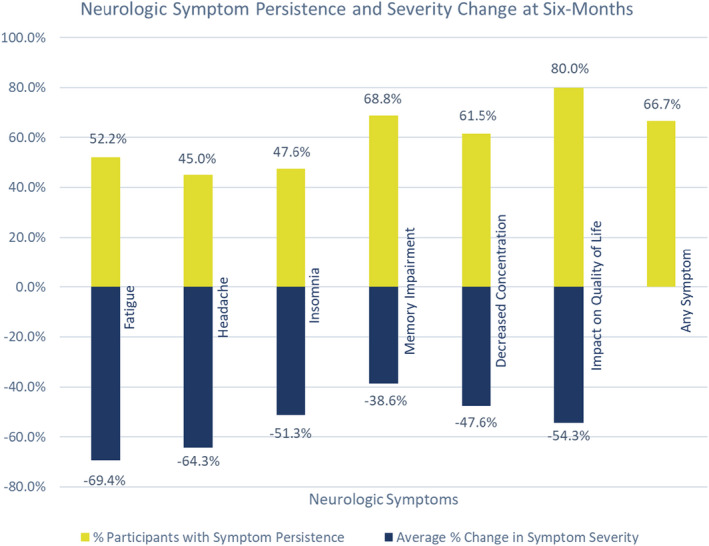
Figure 2.

Neurologic symptom persistence and change in severity by percentage at 6 months. For each symptom, the yellow bars represent the participants with symptom persistence at 6 months as a percentage of all participants with that symptom at baseline. The blue bars represent the average percent decrease in severity score (within individual participants) from baseline to 6 months for each symptom. The final bar labeled “Any Symptom” shows the percentage of participants reporting at least one persistent symptom at 6 months. [Colour figure can be viewed at wileyonlinelibrary.com]
