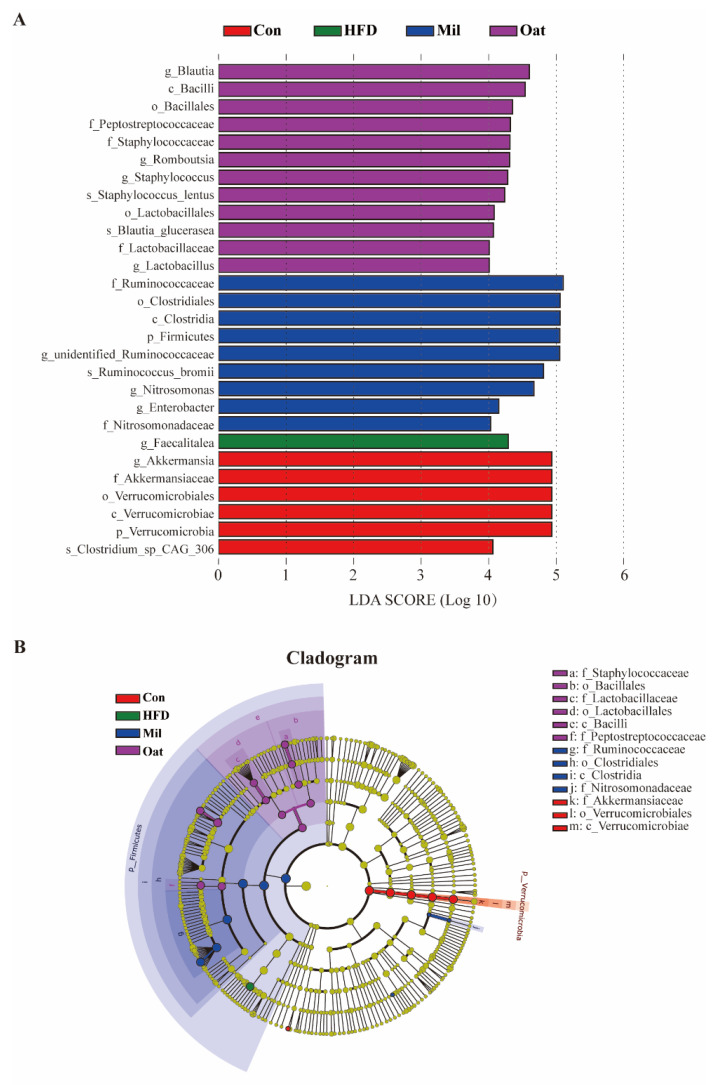
Figure 7.
Linear discriminant analysis (LDA) effect size (LEfSe) analysis of the key genera of gut microbiota in high-fat diet fed rats. (A) Histogram of the LDA scores for differentially abundant bacterial taxa. (B) Cladogram visualizing the phylogenetic distribution of the gut microbiota community. Con group, a basal diet group; HFD group, a high-fat diet group; Oat group, HFD containing 22% oat group; Mil group, HFD containing 22% foxtail millet group; p, phylum; c, class; o, order; f, family; and g, genus.

