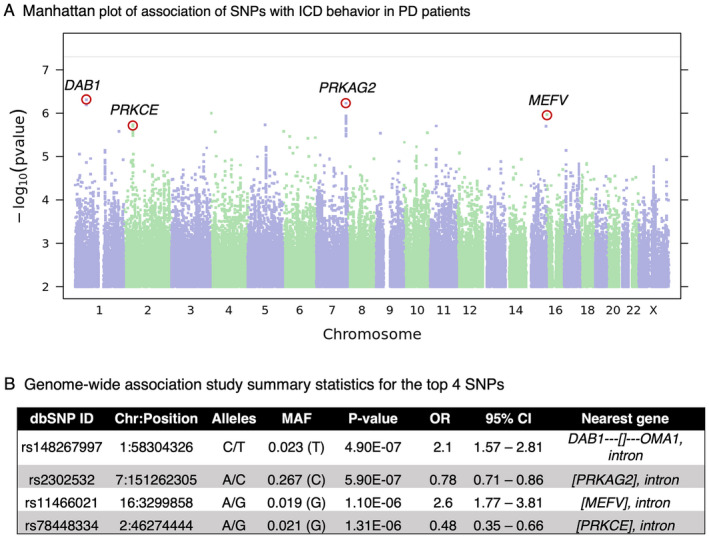
Figure 2.

The top four SNPs revealed by 23andMe GWAS. (A) Manhattan plot of GWAS on 23andMe Cohort comparing PD subjects with and without ICD behavior. For each SNP, −log10 scaled p‐value is plotted against chromosomal position. The top 4 SNPs (p < 1.30e‐06) are labeled by the nearest gene. The horizontal solid line indicates the genome‐wide significant cutoff p‐value (p = 5.0e‐08). (B) GWAS summary statistics for the most highly associated variants. For each SNP we show: dbSNP build 146 rsid, chromosomal position (GRCh37 build), the two SNP alleles (A1/A2) in alphabetical order, OR for allele A2, the association test p‐value adjusted for genomic inflation, the confidence interval based on the standard error of the effect size, and the nearest gene. The nearest gene legend: [Gene1, Gene2,…] = The SNP is contained within the transcripts of the specified gene(s). Gene‐‐‐[] = The SNP is flanked by gene on the left and there is no gene within 1 Mb on the right. []‐‐‐Gene = The SNP is flanked by gene on the right and there is no gene within 1 Mb on the left. ICD, impulse control disorder; PD, Parkinson's disease; GWAS, Genomewide Association Study; OR, odds ratio. [Colour figure can be viewed at wileyonlinelibrary.com]
