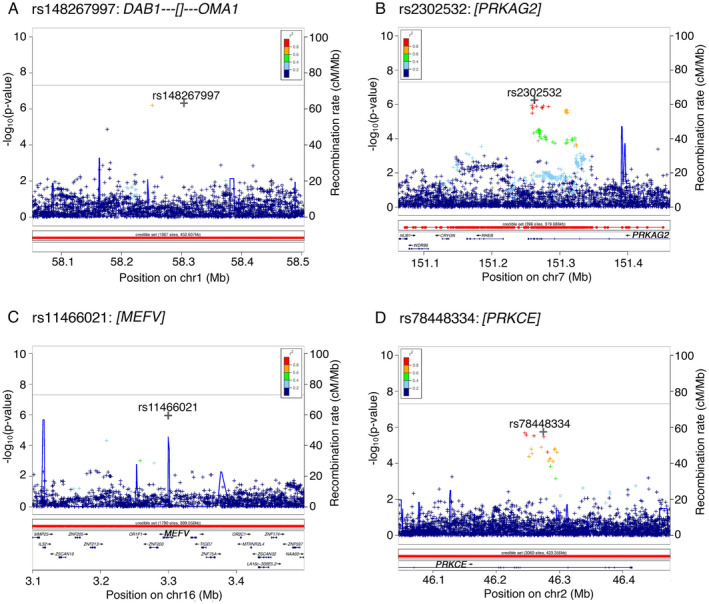
Figure 3.

Regional association plots of both genotyped and imputed SNPs across four genomic regions linked to ICD behavior in PD subjects. (A) Region chr1p32.2 shows association of rs148267997 annotated to DAB1. (B) chr7q36.1 region with rs2302532 as a top associated SNP annotated to PRKAG2. (C) chr16p13.3 region with rs11466021 as a top associated SNP annotated to MEFV. (D) Region chr2p21 shows association of rs78448334 annotated to PRKCE. A –log10 p‐value for association between individual SNPs and ICD is plotted against the SNP's chromosomal position. X‐axis shows physical position based on NCBI genome Build 37. The right y axis shows the recombination rate (solid blue line on the plots) estimated from 1000 Genomes Project. A symbol “o” indicates a genotyped variant, a “◊” indicates a protein altering genotyped SNP, “+” is an imputed variant, and an “x” indicates a protein‐altering imputed SNP. Color represents the pairwise LD with the SNP with the most significant p‐value at each locus computed from a set of 10,000 23andMe samples. ICD, impulse control disorder; PD, Parkinson's disease. [Colour figure can be viewed at wileyonlinelibrary.com]
