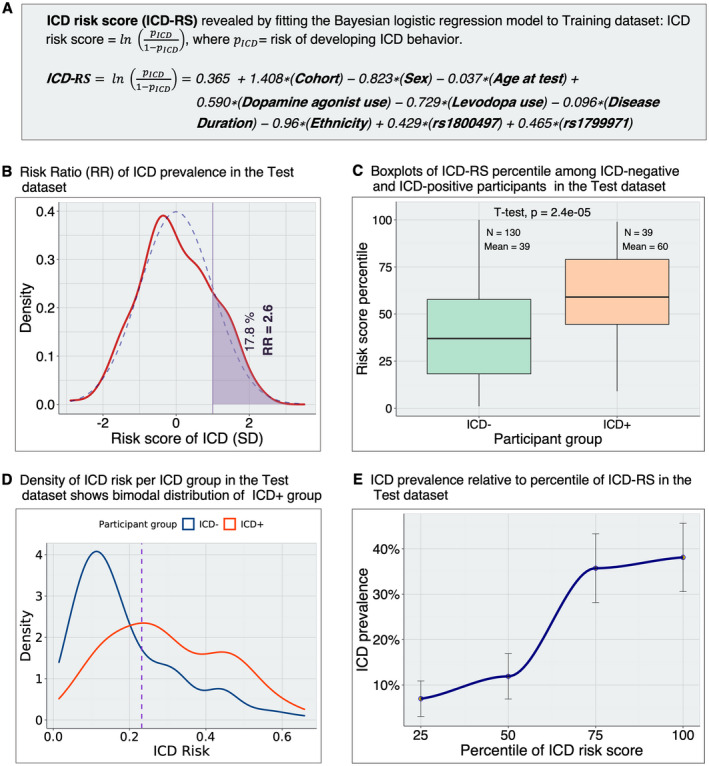
Figure 5.

Risk scores for development of ICD behavior in PD subjects. (A) Calculation of ICD‐RS in the Test dataset. We calculate the ICD‐RSs for each participant in the Test dataset using the log odds (coefficient estimates) obtained by fitting the final Bayesian logistic regression model to the Training dataset. (B) Distribution of the RR in the Test dataset. The RR is the ratio of the empirical ICD prevalence within subgroups of the Test dataset. First, we calculated the ICD prevalence in the group of PD participants with ICD‐RS >1 SD above the mean of ICD‐RS. Then, we calculated ICD prevalence in the remainder of the PD participants (ICD‐RS below the cutoff of +1 SD): . The participants above 1 standard deviation of ICD‐RS have 2.6‐fold higher rates of ICD behavior than the rest of the participants in the Test dataset. Dashed blue and solid red lines represent normal and empirical distribution of ICD‐RS, respectively. (C) ICD‐RS (log odds) percentile among ICD+ versus ICD− PD participants in the Test dataset. While the horizontal line within the box indicates the median, we also show the percentile mean for each group. Both median and mean percentile are higher in the ICD+ group. (D) Distributions of risk (pICD) per ICD group. Both ICD+ PD and ICD− PD are skewed to the left because only ~23% of participants are ICD+. The purple dotted line indicates the best threshold (0.23) as estimated by the closest.topleft method. (E) The relationship between prevalence of ICD and ICD‐RS percentiles in the Test dataset. Error bars indicate standard errors (SE) generated by 1000 bootstrap replicates. ICD prevalence, binned according to percentiles of ICD‐RS, is highly correlated with ICD‐RS percentiles. Empirical ICD prevalence increases from 7% in individuals within the lowest quartile of ICD‐RS to 38% in the highest quartile. ICD, impulse control disorder; ICD‐RS, ICD risk scores; RR, risk ratio. [Colour figure can be viewed at wileyonlinelibrary.com]
