
Fig. 4.
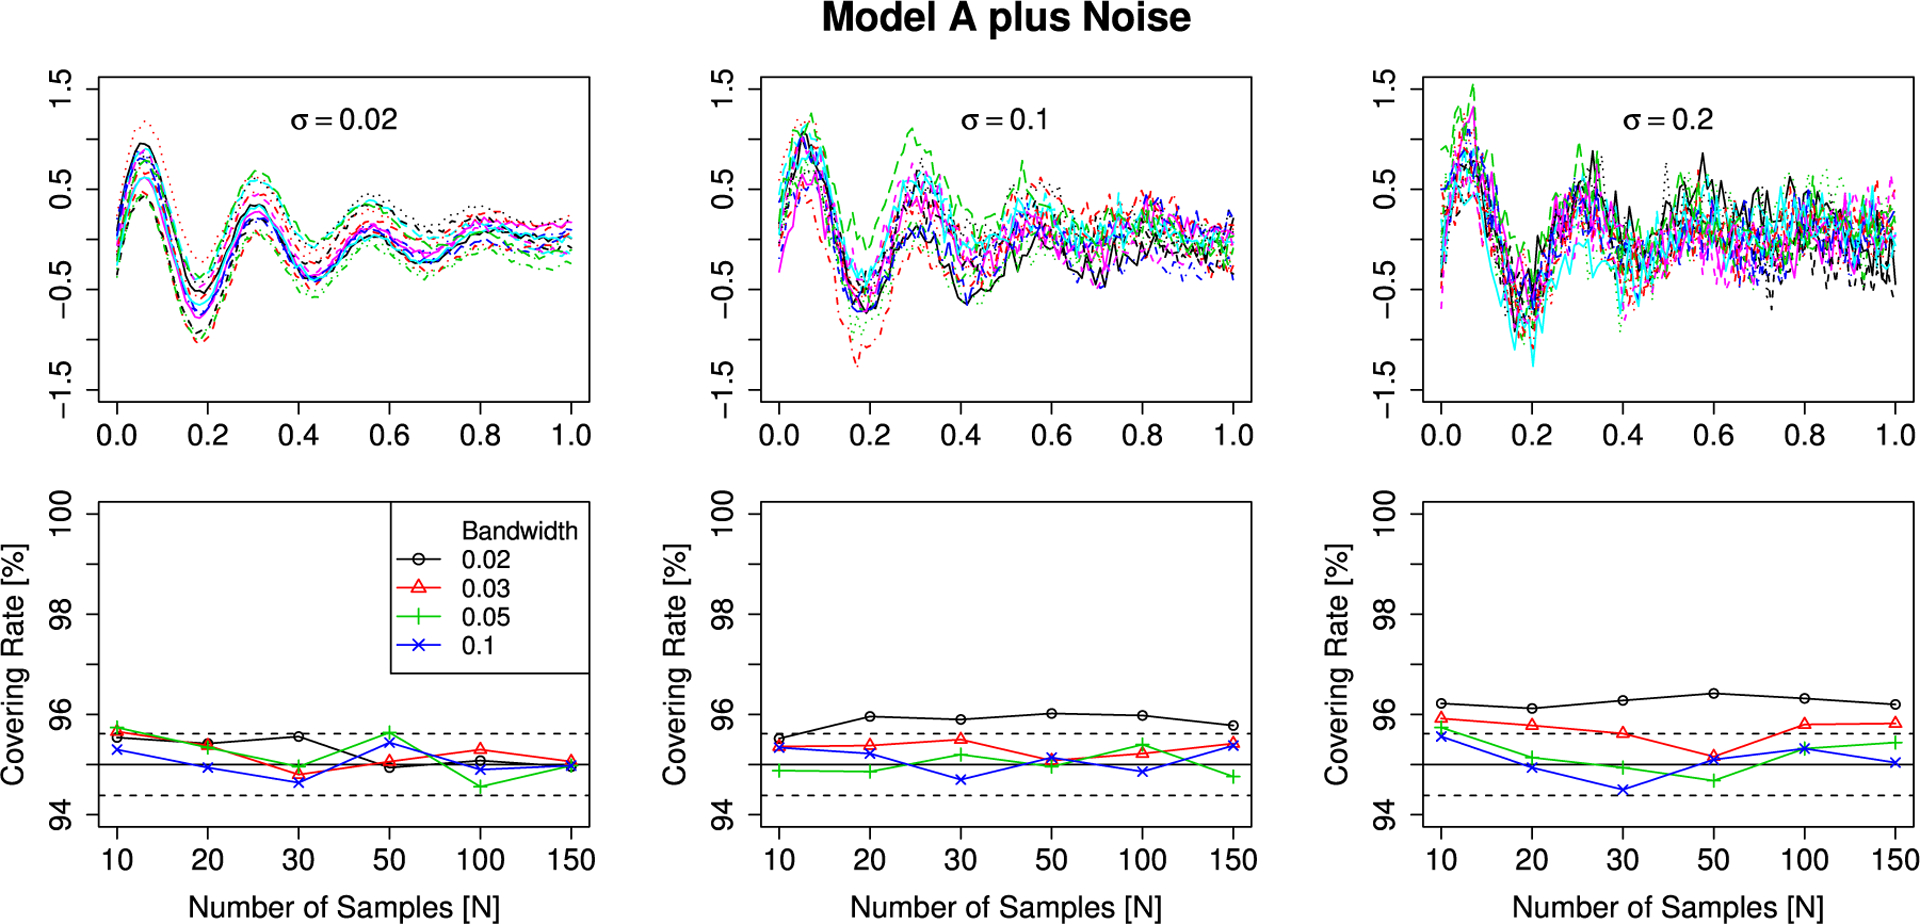
Simulation results for Gaussian fields (Model A) with observation noise. Top row: samples from the error fields. Bottom row: simulated covering rates. The solid black line is the targeted level of the SCBs and the dashed black line is twice the standard error for a Bernoulli random variable with p = 0.95.