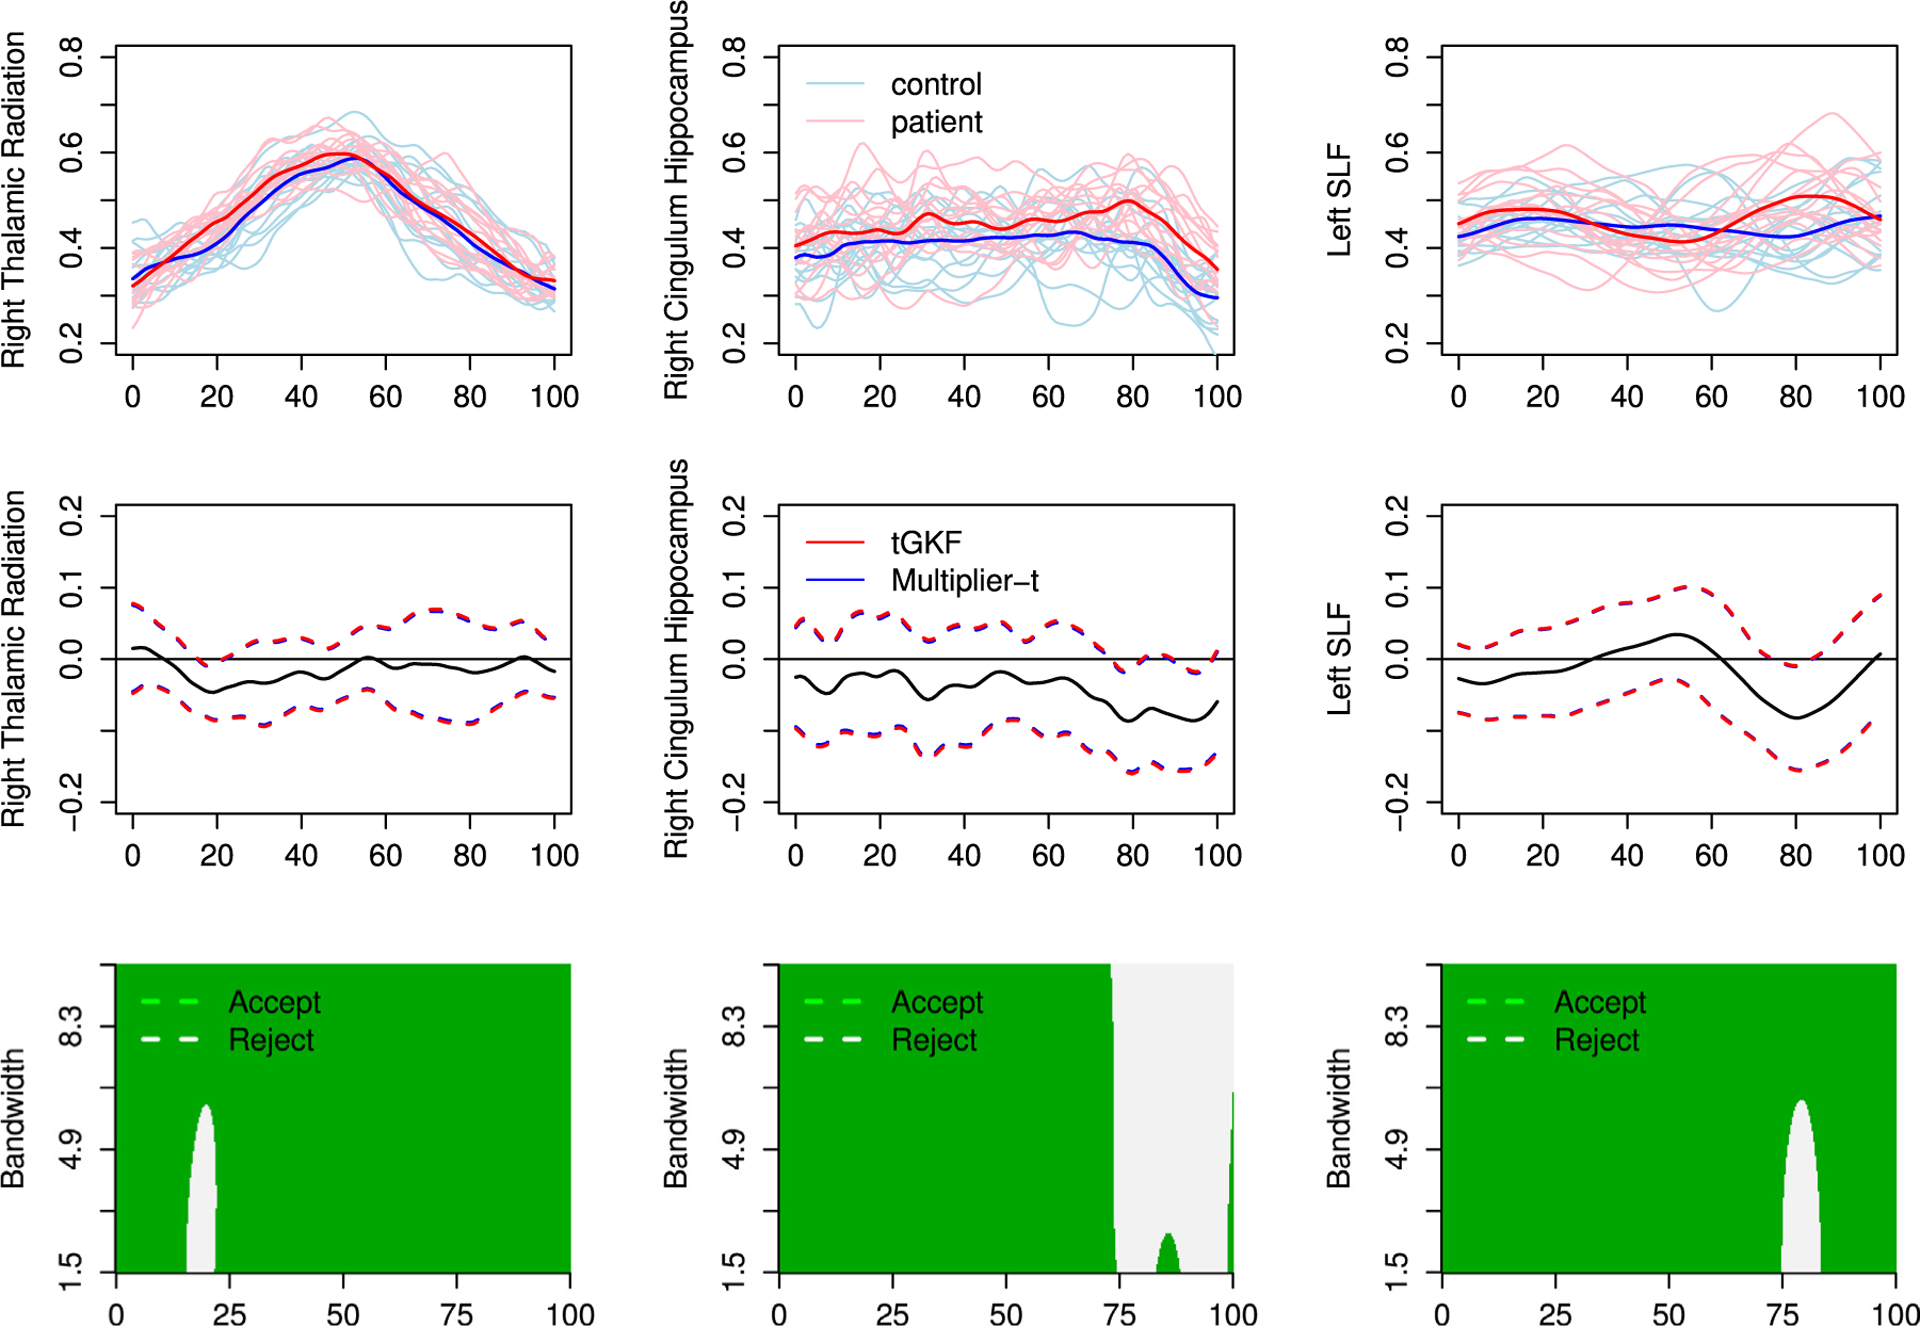
Fig. 8.

DTI fibers with significant differences in the mean function. Top row: data and sample means. Middle row: estimated difference of the mean function and 95%-SCBs constructed using the tGKF and the Multiplier-t. Bottom row: areas where the confidence bands for the difference in the mean function for the scale field do not include 0.
