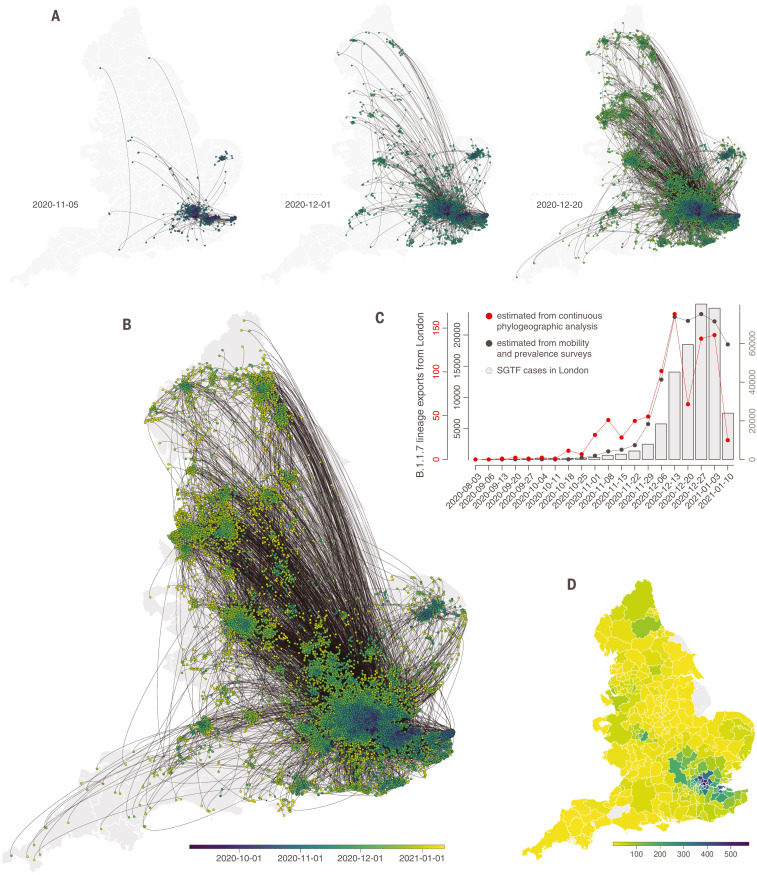
Fig. 2. Spatial emergence dynamics of SARS-CoV-2 lineage B.1.1.7 in England.
(A and B) Continuous phylogeographic reconstruction with phylogeny nodes colored according to their time of occurrence and dispersal direction of phylogeny branches indicated by edge curvature (counterclockwise). From left to right, data to 5 November, 1 December, and 20 December 2020, respectively. (B) Map of the entire reconstruction, up to 19 January 2021. (C) Estimated number of weekly exports of lineage B.1.1.7 from the Greater London area, inferred from the continuous phylogeographic analysis (red), and estimated from mobility and prevalence survey data (black). (D) Estimated number of cumulative B.1.1.7 introductions inferred from phylogeographic analysis into each administrative area (UTLA) by 12 December 2020.

