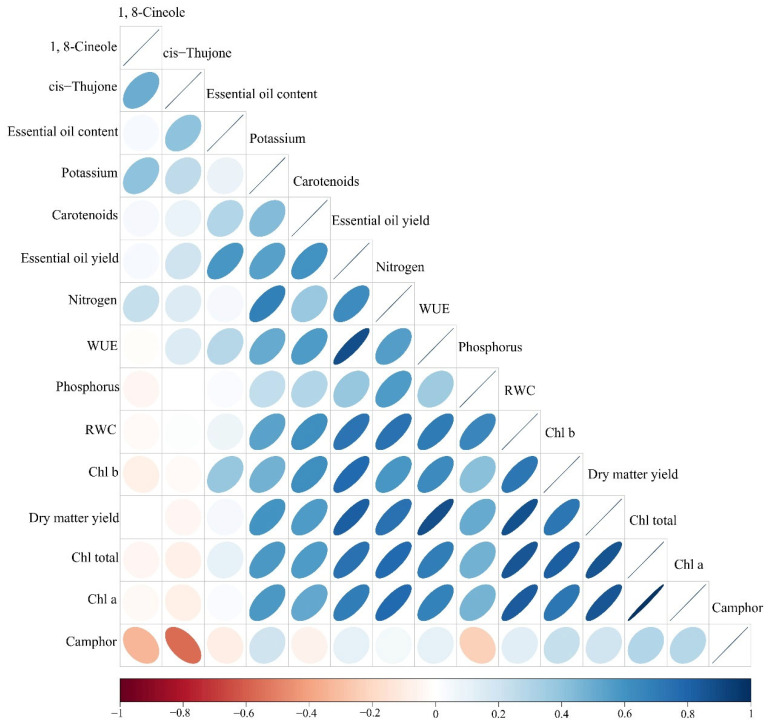
Figure 6.
Pearson’s correlation matrix for studied traits of sage. Color ellipses illustrate statistically significant levels. Positive and negative correlations are shown in blue and red, respectively. The color legend on the bottom-hand side of corrplot represent the intensities of Pearson correlation coefficients.

