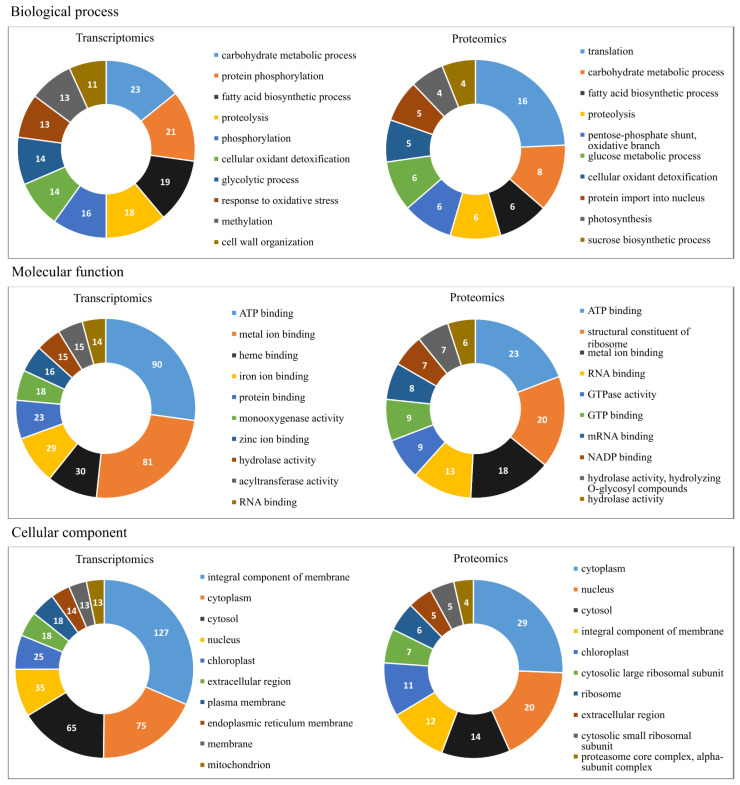
Figure 1.
Gene Ontology (GO) annotation classification statistics graph from full-length transcriptome and proteome in the leaves of young oil palm plants under salinity stress; classified accordingly to biological process, cellular component, and molecular function. Only the ten most populated groups per GO term are shown. Numbers represent the amount of positive hits.

