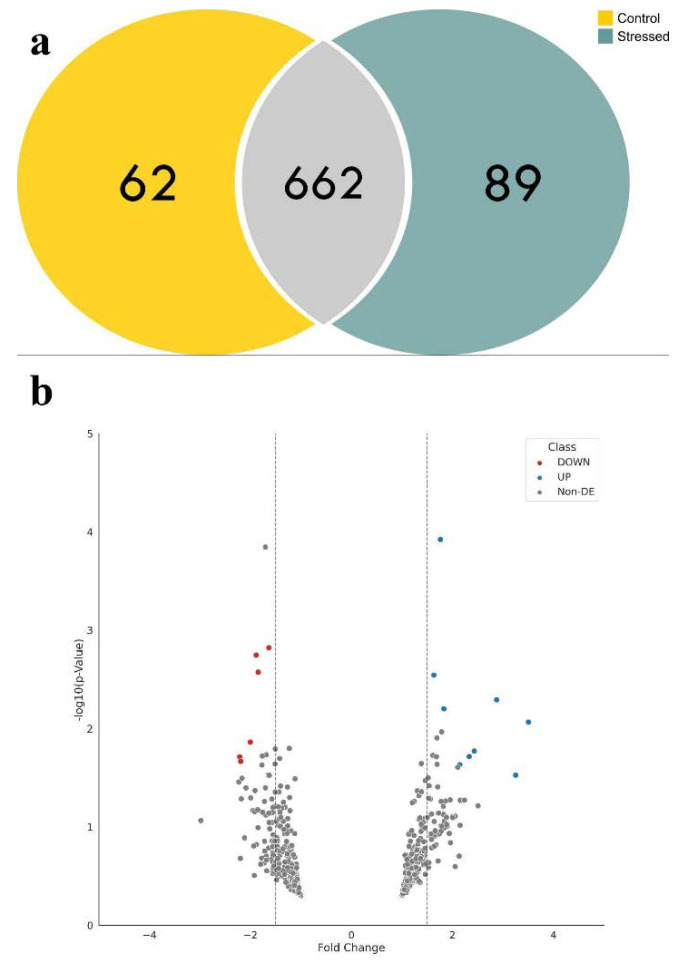
Figure 3.
Summary of the proteomics analysis performed on the leaves of young oil palm plants under salinity stress using the PatternLab for Proteomics V software. (a) Control and stressed conditions shared 662 protein identifications; 62 and 89 proteins were uniquely detected in control and stressed samples, respectively; (b) volcano plot of the differentially abundant proteins reported by Pattern Lab’s T Fold module, where 20 proteins showed statistically significant differences in their abundance—proteins in blue were significantly up-regulated while the ones in red were significantly down-regulated between stressed and control samples.

