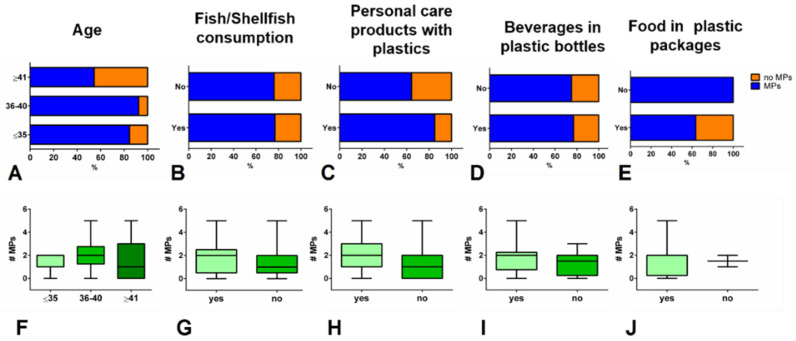
Figure 3.
Percentage abundances of samples with (MPs) and without (no MPs) microplastics, divided according to the following selected parameters: (A) age of patient; (B) consumption of fish/shellfish in the 7 days prior to the expected date of delivery and 7 days after; (C) use of personal care products with plastic compounds in the 7 days prior to the expected date of delivery and 7 days after; (D) consumption of beverages in plastic bottles in the 7 days prior to the expected date of delivery and 7 days after, and (E) consumption of food in plastic packaging in the 7 days prior to the expected date of delivery and 7 days after. Number of identified microplastics divided according to the above-defined parameters (F–J) (box charts: centre line marks the median, edges indicate the 5th and 95th percentiles, and whiskers indicate the minimum and maximum values).

