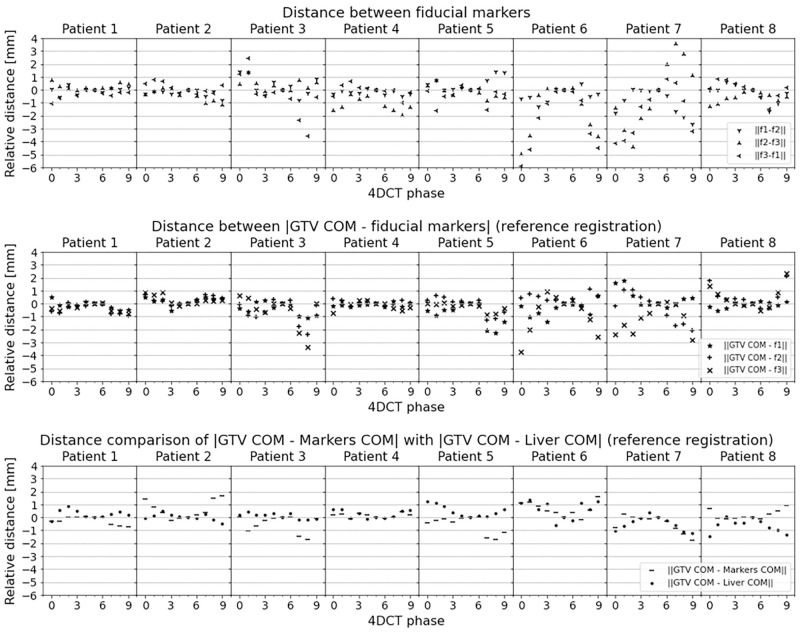
Fig 5. Comparisons of markers distance stability.
The distances within each phase are measured relatively to the base distance measured at reference phase (50% phase). The top panel shows the distance between the markers. For some patients the marker to marker distance differ in the breathing cycle up to 6mm. This clearly demonstrates that individual markers are problematic surrogates of the tumor in the liver. The middle panel shows the distance between the GTV COM and each fiducial marker. Some of the markers change their distance with the tumor up to 4mm. The bottom panel depicts the relative distance of the GTV COM with the liver COM. GTV COM and liver COM are estimated with deformable image registration. Errors are up to 1.2mm.

