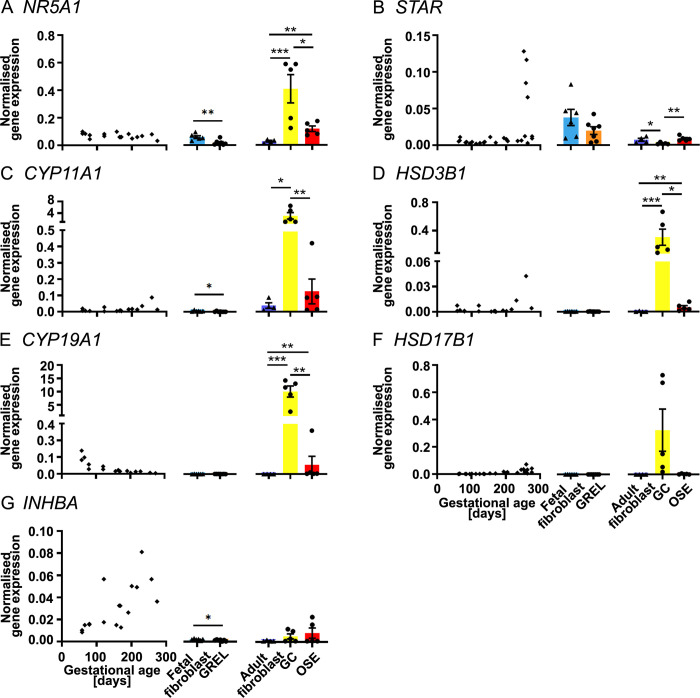
Fig 4. mRNA expression levels of genes involved in hormone production.
Scatter plots in each subfigure show gene expression levels in fetal ovaries at different gestational ages (n = 27), and scatter plots for NR5A1 (A), CYP11A1(C), HSD3B1 (D), CYP19A1 (E) and INHBA (G) are from our previous publications [30, 31]. Gene expression levels in cultured GREL cells (n = 7; gestational ages are 51, 56, 73, 110, 110, 127 and 177 days) and fetal fibroblasts (n = 6; gestational ages are 51, 73, 101, 110, 110 and 177 days) are presented as mean ± SEM (normalised to PPIA and RPL32) in the middle graph of each subfigure. The differences between GREL cells and fetal fibroblasts were analysed with Student’s t-tests. Data of gene expression in adult fibroblasts (n = 4), granulosa cells (GC; n = 5) and ovarian surface epithelium (OSE; n = 5) are presented as mean ± SEM (normalised to PPIA and RPL32) in the graph on the right side of each subfigure. Significant differences among the three adult cell types were determined by one-way ANOVA with Tukey’s post-hoc test. * P < 0.05, *** P < 0.001.

